Figure 5.
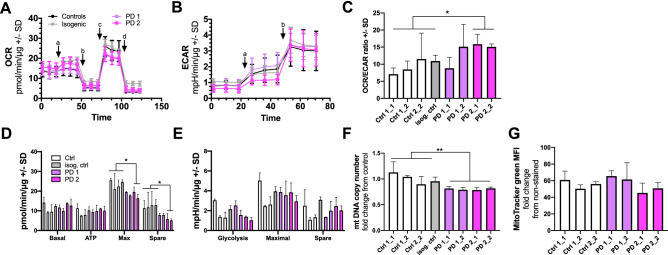
PD astrocytes have altered metabolic profile. (A) Oxygen consumption rate (OCR) following additions of 10 μM glucose (A), 1 μM oligomycin (B), 1 μM FCCP (C), and 1 μM antimycin A and rotenone (D) in astrocytes. (B) Extracellular acidification rate (ECAR) following additions of 10 μM glucose (A) and 1 μM oligomycin (B). Results are normalized to protein content and shown as mean ± SD from three independent experiments. (C) The OCR/ECAR ratio calculated after glucose addition. (D) Calculated OCR values of basal respiration, ATP production, maximal respiration, and spare respiratory capacity. (E) Calculated ECAR values of glycolysis, maximal glycolysis, and spare glycolytic capacity. (F) mtDNA copy number measured from astrocytes. Results are shown as relative fold change to healthy cells. (G) MitoTracker green Mean Fluorescence Intesity (MFI) per cell, representing mitochondrial mass. Bars represents mean ± SD, *p < 0.05, **p < 0.01. The order of lines in (D) and (E) is the same as in (C).

