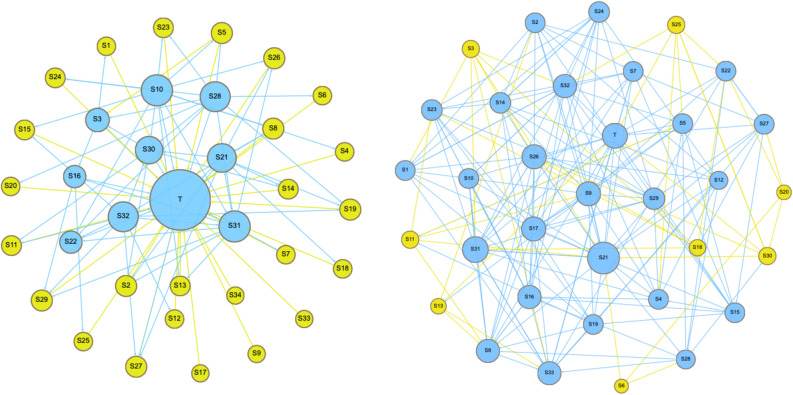
Figure 3.
A visual plot of both networks: the teaching network on the left side with a centralised teacher as well as a rich club of collaborators (in blue). The collaborative network on the right side showing a more collaborative diverse participatory pattern, the rich club (in blue) includes the majority of students. Each circle represents a member of the group, blue colour points to members of the rich club, arrows represent direction of interactions, the node size is proportional to the degree centrality.

