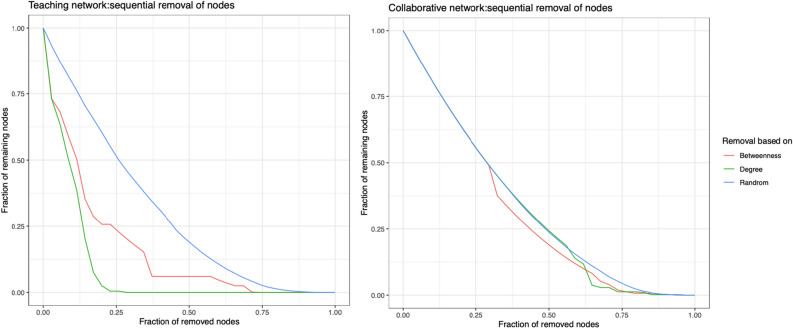
Figure 6.
Shows the effect of sequential removal of active actors in both networks based on the highest degree (green) and highest betweenness centrality (red) compared to random removal (blue). On the left side, the connected network size dropped to 0 after the removal of 25% of actors, while in the collaborative network, the removal of the most connected actors was comparable to the random removal of actors. The simulation videos of the dynamics of sequential removal of the most active actors shows the interactions in each network after each removal.

