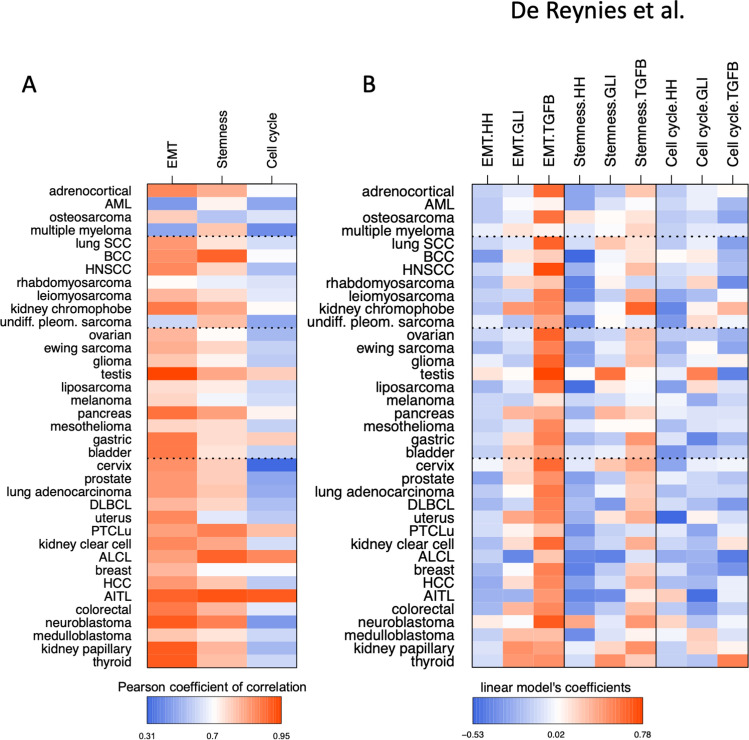
Figure 2.
Multivariate linear prediction models of metagene signatures for select major oncogenic traits (mesenchymal/EMT, stemness, cell cycle). (A) Heatmap representation of the correlations between predicted and observed values of metagenes in 37 tumor types, taking GLI1/GLI2, the three HH and three TGFB genes together. Corresponding numerical values are provided in Supplementary Table S4B. (B) Heatmap representation of the coefficients from the linear models for each of the 3 metagenes in each tumor type, based on the combined expression of either GLI1 and GLI2, or the three HH or TGFB genes. Corresponding numerical values are provided in Supplementary Table S4B.

