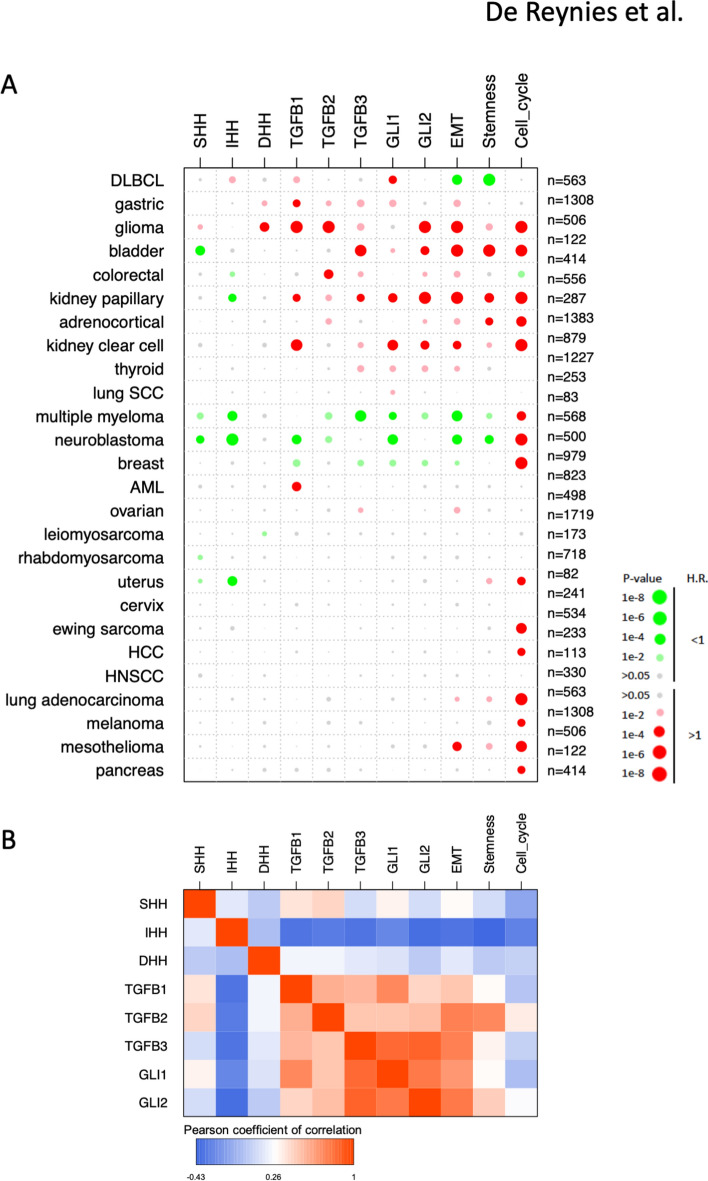
Figure 3.
Prognostic value associated with GLI(1/2), HH(S/I/D) and TGFB(1/2/3) genes and the mesenchymal/EMT, cell stemness and cell cycle metagenes in human cancers. (A) Data were derived from a meta-analysis for the univariate prognostic value for overall survival in 26 types of human cancers for which sufficient events were available. Bigger circles represent lower p values. Marked colors represent p value below 0.001, dull colors represent p values below 0.05. Green and red colors represent H.R. below and above 1, respectively (see scale bar). (B) Correlations between pan-cancer profiles of prognostic scores of GLI(1/2), HH(S/I/D) and TGFB(1/2/3) genes and the mesenchymal/EMT, cell stemness and cell cycle metagenes. Prognostic scores are defined as the log2(H.R.) if the related p-value is below 0.05, or 0 otherwise.

