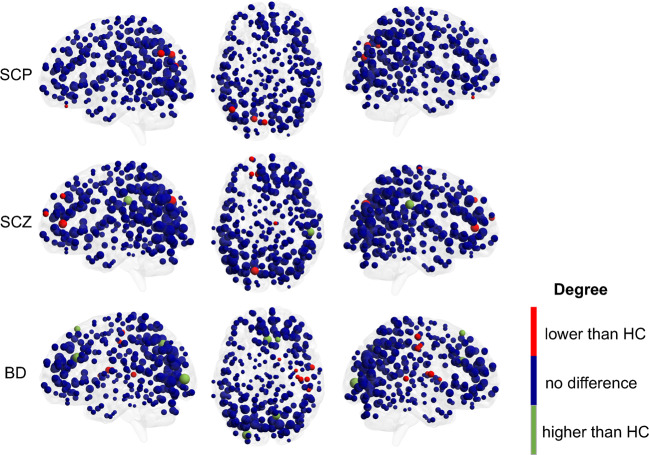
Fig. 2. Visualization of regional degree differences between the networks of psychosis groups and age-matched healthy controls.
The nodal size corresponds to their degree. Blue nodes mark regions that do not differ compared to healthy controls, while red nodes mark regions with a lower degree and green nodes mark regions with a higher degree compared to controls. HC healthy controls, SCP subclinical psychosis, SCZ schizophrenia spectrum disorder, BD bipolar disorder with psychosis.

