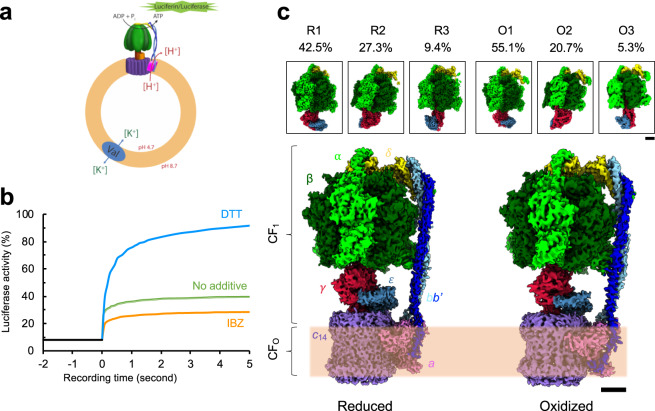
Fig. 1. Chloroplast ATP synthase (CF1FO) of Spinacia oleracea in two different redox states.
a Schematics of the experimental design for measuring CF1FO function. Purified CF1FO was reconstituted into a liposome (orange) mixed with lipids of phosphatidylcholine and phosphatidic acid. The generated pH gradient across the membrane drove the reconstituted CF1FO to synthesize ATP molecules, which were detected using a luciferin/luciferase assay (green). Val indicates valinomycin. b Profile of the CF1FO activity measurements of the CF1FO in different redox states. Blue curve represents the sample with dithiothreitol (DTT) (reduced), orange the sample with iodosobenzoate (IBZ) (oxidized), and green the sample with no redox agent added (control). c Cryo-EM density maps of the oxidized and reduced forms of the CF1FO. Percentages of the particle images used are listed for individual rotary states. Scale bars indicate 25 nm. Color codes: α (light green), β (dark green), δ (yellow), bb' (blue and light blue), γ (crimson), ε (indigo), a (light pink), and c ring (purple). R indicates a reduced state, and O indicates an oxidized state. Membrane bilayer is indicated with the light orange band. The three-dimensional (3D) reconstructions are categorized into three different rotary states (states 1, 2, and 3). Upper insets are the density maps of the F1 domains.

