Figure 6.
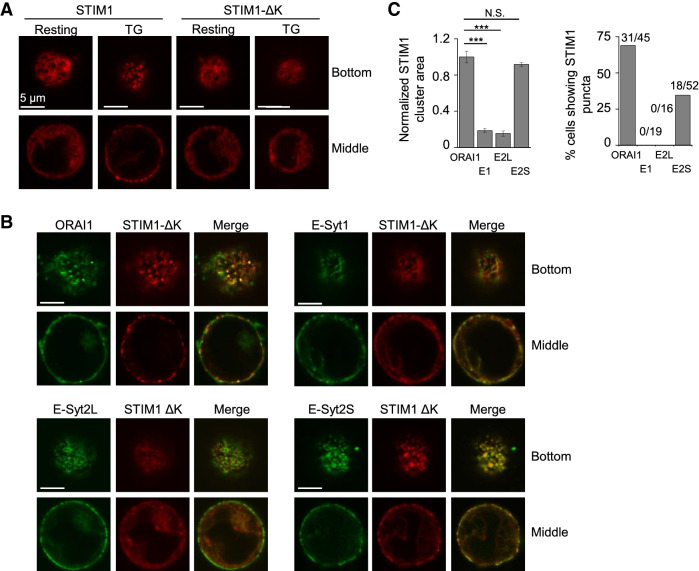
E-Syt2S mediates STIM1 recruitment to the ER-PM junctions. (A) Representative confocal images of Jurkat T cells expressing STIM1-mCherry and STIM1-ΔK-mCherry under resting and store-depleted conditions. (Scale bars: 5 μm). (B) Representative confocal images of Jurkat cells expressing STIM1-ΔK-mCherry together with ORAI1-YFP, E-Syt1-GFP, E-Syt2L-GFP, or E-Syt2S-GFP after store depletion with thapsigargin (TG) in Ringer’s solution containing 2 mM Ca2+ (scale bars: 5 μm). (C) The left bar graph shows normalized STIM1 clustering area in cells expressing STIM1-ΔK-mCherry together with ORAI1-YFP (N = 8 cells), E-Syt1-GFP (N = 8 cells), E-Syt2L-GFP (N = 6 cells), or E-Syt2S-GFP (N = 6 cells) after store depletion with thapsigargin. ***p < 0.001, N.S. not significant. The right Bar graph shows percentage of cells showing STIM1 accumulation in puncta in cells expressing STIM1-ΔK-mCherry together with ORAI1-YFP (N = 45 cells), E-Syt1-GFP (N = 19 cells), E-Syt2L-GFP (N = 16 cells), or E-Syt2S-GFP (N = 52 cells) after store depletion with thapsigargin. Numbers on the top of each bar represent the number of cells showing STIM1 accumulation into puncta over the total number of cells examined.

