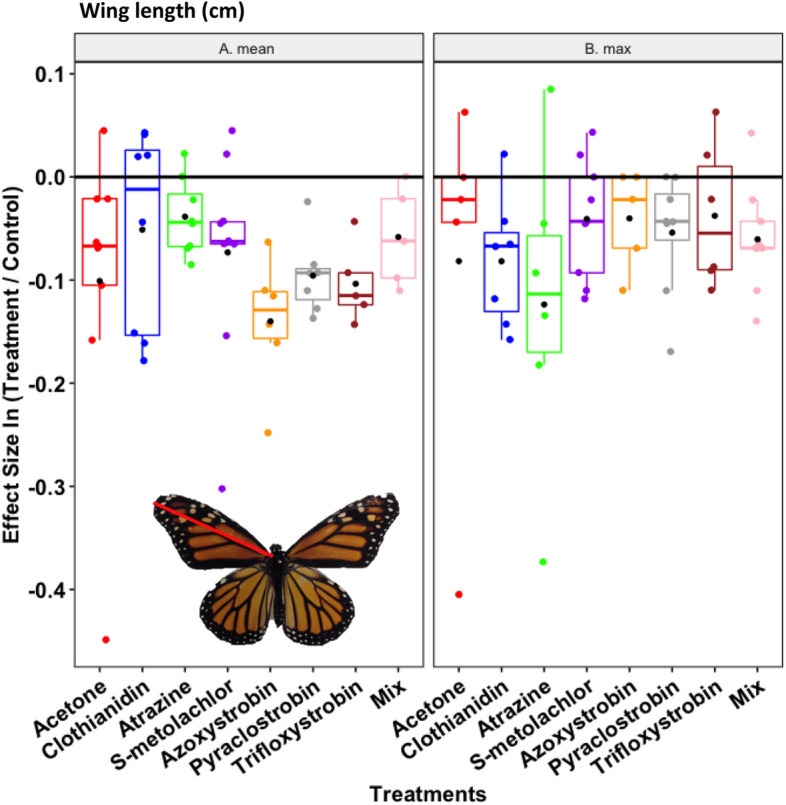
Figure 4.

Butterfly adult size (cm wing length; red line on inset monarch photo), after being reared on milkweed leaves treated with the solvent control (acetone) and those experimentally treated to simulate the A) mean and B) maximum concentrations of field values for six pesticides and their combination (mix). An effect size at zero—i.e., the black horizontal line—represents no quantitative difference between the treatment and control, whereas positive or negative values indicate relative increases or decreases, respectively. Box plots show median values with 95% confidence intervals. Black circles are the treatment mean and colored circles are individual data points. Photo credit: Paola Olaya-Arenas.
