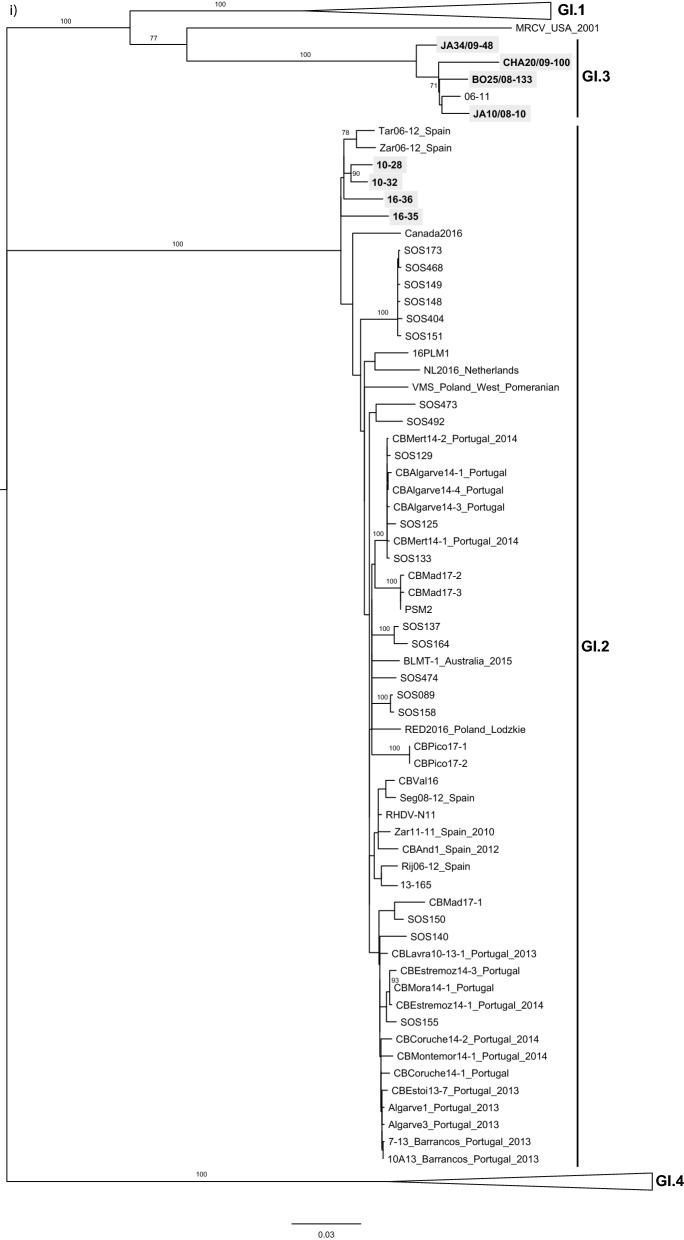
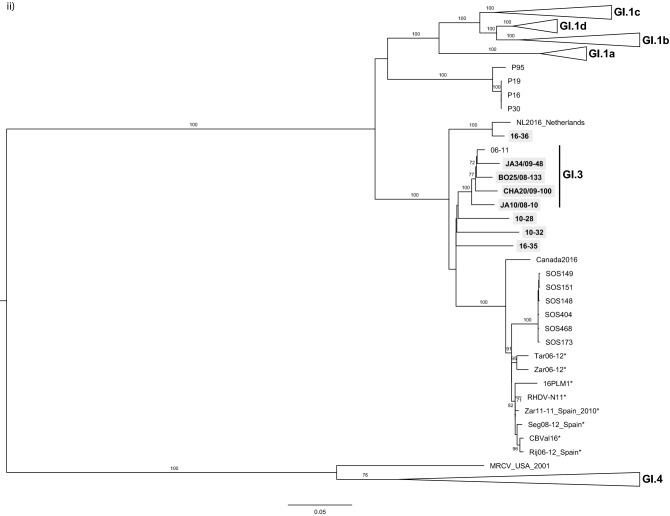
Figure 2.
Maximum Likelihood (ML) phylogenetic trees for (i) the structural genes VP60 + VP10 (n = 221 sequences; nucleotides 5,296–7,369; nucleotide substitution model GTR + G + Γ4), and (ii) the non-structural genes except p16 (n = 221 sequences; nucleotides 430–5,295; nucleotide substitution model GTR + G + Γ4). Horizontal branch lengths are drawn to scale of nucleotide substitutions per site and the trees are mid-point rooted. The percentage of trees in which the associated taxa clustered together was determined from 1,000 bootstrap replicates and is shown next to the branches (only bootstrap values ≥ 70 are shown). Genotype or variant assignment is according to the ML tree for the structural genes. Sequences obtained in this study appear boxed in grey. *indicates strains considered previously non-recombinant GI.2, but now identified as GI.3/GI.2 recombinants. GenBank accession numbers of the sequences used are listed in supplementary information.


