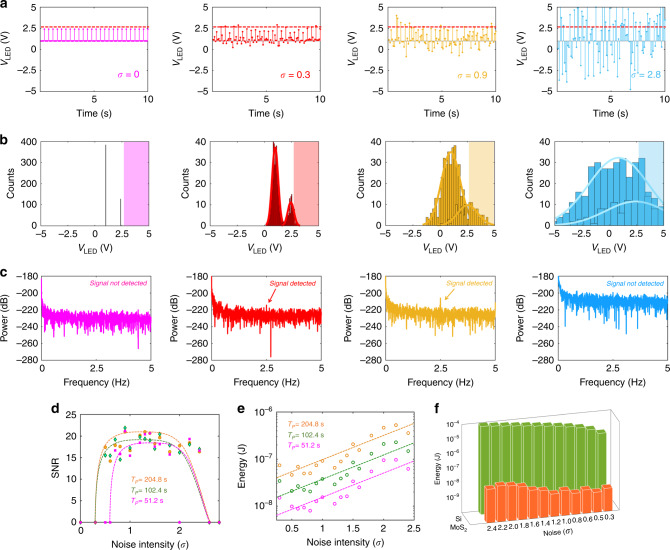
Fig. 4. Demonstration of SR in monolayer MoS2 photodetector.
a White Gaussian noise of different standard deviations (σ) superimposed on 2.5 Hz periodic and subthreshold LED signal of amplitude VLED = 2.4 V and b corresponding histogram of the LED voltage distribution. Each histogram shows two Gaussian curves of the same variance but different means, one centered at VLED = 1 V (LED OFF) and the other one centered at VLED = 2.4 V (Dim LED), marking the level difference between the two states of the LED signal. c PSD plots obtained from the FFT of the output current (IDS) measured in the monolayer MoS2 photodetector for a total duration of TP = 204.8 s in response to the LED signals in (a). The MoS2 photodetector was biased in the OFF-state (VBG = −2 V). In the presence of a finite and appropriate amount of noise, the subthreshold LED signal is detected. (see Supplementary video files 1–3 for real-time observation of SR in the MoS2 photodetector). d SNR as a function of σ for different sampling time TP. For very low variance Gaussian noise (σ < 0.2 V), the signal hardly crosses the detection threshold of the MoS2 photodetector, i.e., VLED = 2.6 V. As σ increases, a larger fraction of the LED signal corresponding to the 2.4 V level crosses the detection threshold of the MoS2 photodetector, increasing the SNR. For even larger variances, the SNR starts to decrease since the tail of the Gaussian distribution centered at VLED = 1 V will also start to cross the detection threshold of the MoS2 photodetector, obscuring the periodicity of the VLED = 2.4 V signal. The SNR curves in this instance show the typical SR response found in biological species such as paddlefish, crayfish, etc. e Energy consumption by the MoS2 photodetector is plotted as a function of σ for different TP. Since the MoS2 photodetector was operated in the deep OFF-state (VBG = −2 V) to minimize the dark current, the operating power budget is drastically reduced, making the signal detection extremely energy efficient. For comparison, refer to Supplementary Note 9 for the exploitation of SR using the Si photodiode (see Supplementary video files 4–6 for real-time observation of SR in the Si photodiode). f The energy consumption by the Si photodiode for detecting subthreshold optical signal, exploiting SR, is found to be in the range of a few micro-Joules, which is 1000X higher compared to the MoS2 photodetector for sampling time TP = 100 s.

