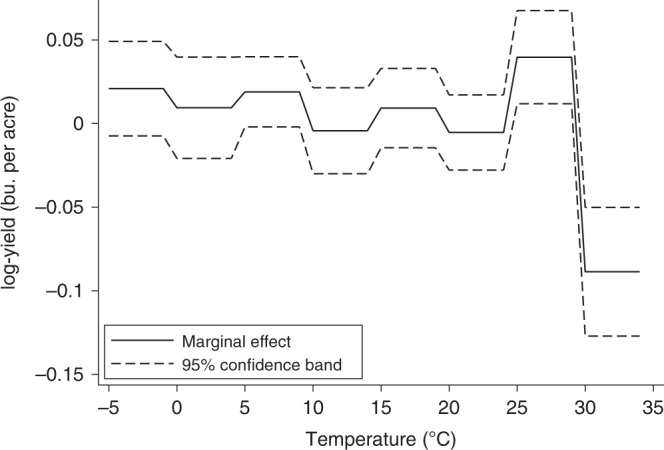
Fig. 2. Marginal effects of temperature bins on wheat yields.

The solid line represents the change in mean log yield if the crop is exposed for one day (24 h) to each 5 °C temperature bin. Dashed lines represent the 95% confidence intervals using standard errors clustered by province-year. These results follow similar patterns to those found in Schlenker and Roberts (2009)43 wherein yields are relatively stable across temperature bins prior to a marginal yield improvement at seemingly optimal temperatures. When critical thresholds are reached, 30 °C in this case, sharp yield reductions occur.
