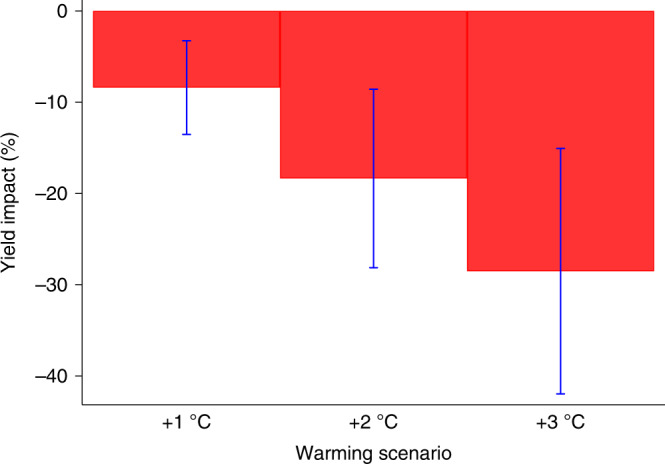
Fig. 3. Wheat yield impacts by +1 to +3 °C warming scenarios.

Impacts are reported as the percentage change in mean yield relative to historical climate. The graph displays the warming impacts under our preferred model for uniform warming scenarios from +1 to +3 °C. Bars show 95% confidence intervals using standard errors clustered by province-year for n = 18,881 yield observations. Results from a uniform warming scenario of +1 °C show an average wheat yield reduction of 8.5% (Delta Method = −3.21, p = 0.001), which increases to 18.4% (Delta Method = −3.68, p = 0.000) and 28.5% (Delta Method = −4.16, p = 0.000) under +2 and +3 °C scenarios.
