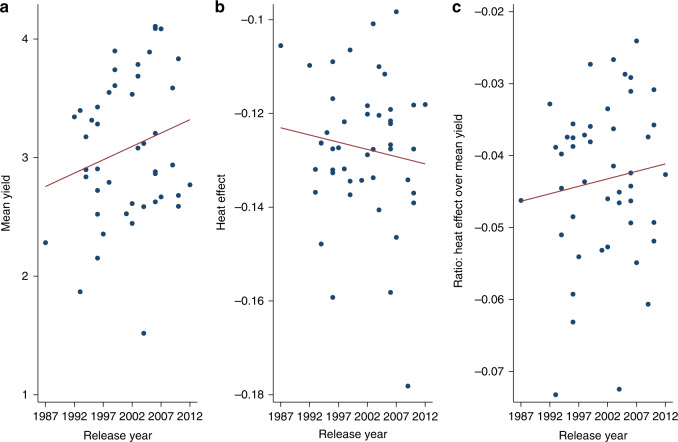
Fig. 5. Mean yields and the effect of heat across wheat cultivar release years.
The figure shows the tradeoff between mean yields and the effect of temperature occurrences above 30 °C (heat effect) across cultivars based on the year they were commercially released. Data points are for specific cultivars and lines are linear trends. Panels a, b, and c report values for mean yields, heat effects, and the heat effect normalized by mean yield, respectively.

