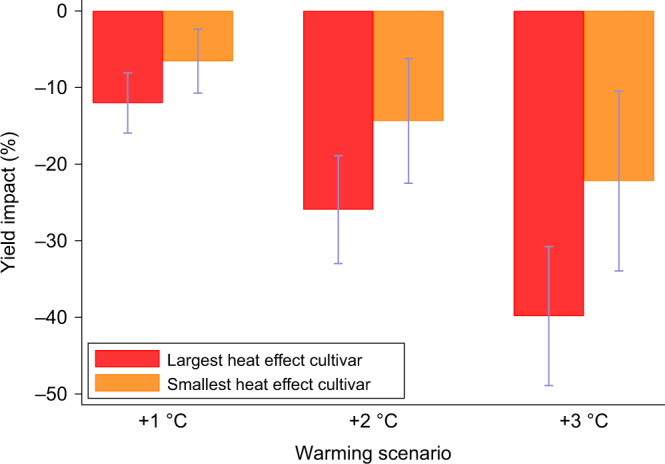
Fig. 6. Comparison of warming impacts on wheat yields for the cultivars with the largest and smallest heat effects.

We allow the effect of temperature exposures above 30 °C to vary across cultivars. Impacts are reported as the percentage change in mean yield under +1 to +3 °C warming scenarios relative to historical climate. Each 2-bar cluster shows warming impacts for the cultivars with the largest and smallest heat effect. Bars show 95% confidence intervals using standard errors clustered by province-year for n = 18,881 yield observations. .
