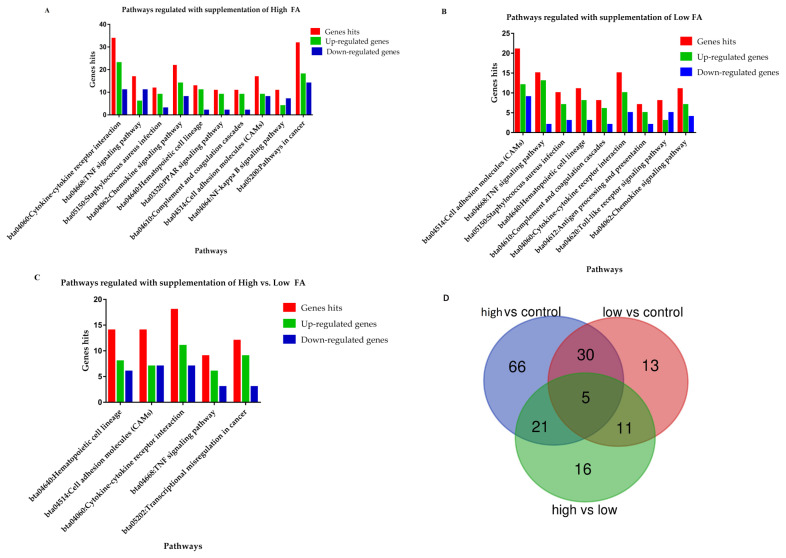
Figure 3.
The graphical presentations of biological pathways involved in response to folic acid treatments. (A and B) The immunity associated pathways mediated in response to high and low folic acid treatments separately. (C) The immunity associated pathways in the comparison of high vs low. (D) The Venn diagram showed the distributions and shared genes among the three comparisons.

