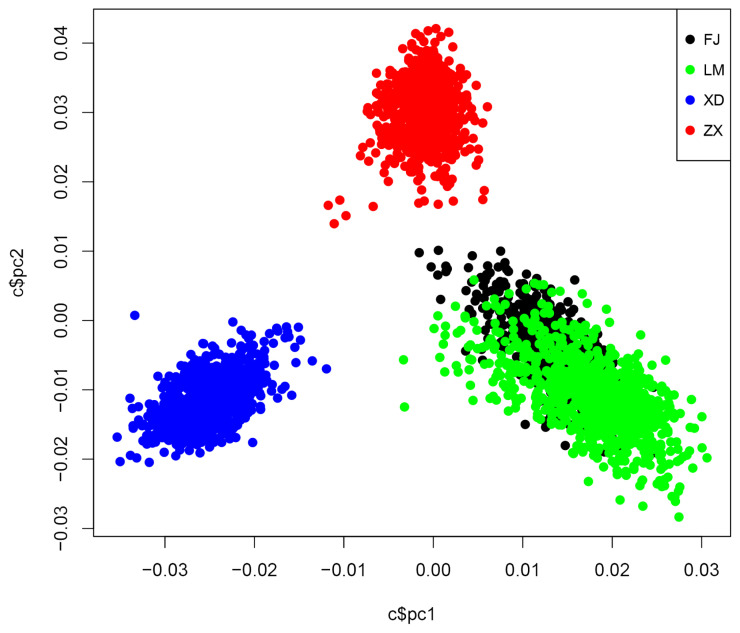
Figure 1.
The statistics of population structure in 4 Yorkshire populations. PCA, principal component analysis for 4 Yorkshire populations. XD, FJ, LM, and ZX represent 4 Yorkshire populations from 4 elite Chinese pig breeding farms. pc1 = first principal component; pc2 = second principal component.

