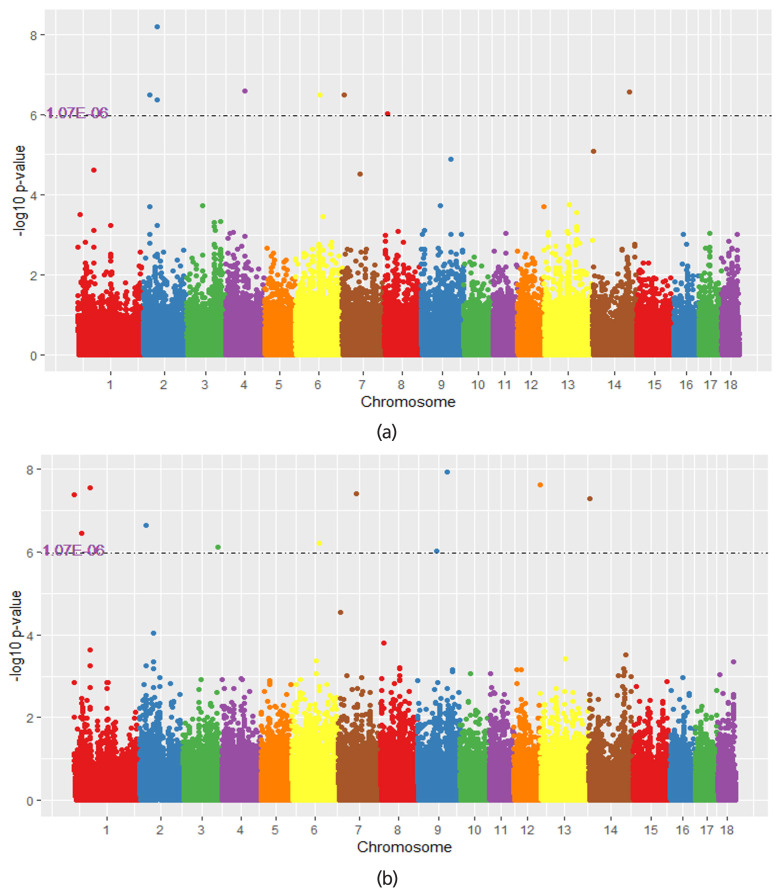
Figure 2.
Manhattan plot of different analyses methods for total number born (TNB) and number born alive (NBA). The x-axis represents the chromosomes and the y-axis represents the −log10(p-value). The dotted line indicates the significance threshold for the (a) the result of MS-GWAS in the 4 populations for NBA, (b) the result of MS-GWAS meta-analysis in the 4 populations for TNB.

