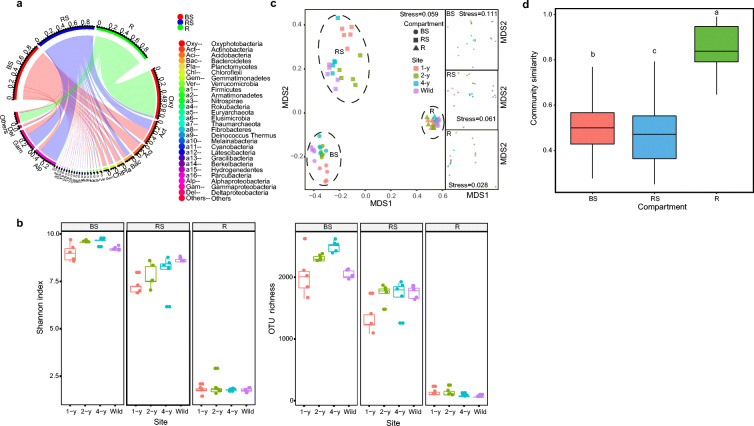
Fig. 2.
(a) Circos plot showing the phylum distribution of licorice root-associated bacterial communities in the three soil–root compartments. Because the relative abundance of Proteobacteria was greater than 25%, bacteria in this phylum are shown at the class level. (b) Boxplots of the alpha-diversity (Shannon index and operational taxonomic unit [OTU] richness) of root-associated bacteria across different sites in the three soil–root compartments. (c) Nonmetric multidimensional scaling (NMDS) of root-associated bacterial community composition across different sites in three soil–root compartments based on Bray-Curtis distances. The three insets represent the three soil–root compartments. (d) Boxplots of root-associated bacterial community similarity among the three soil–root compartments. Different letters indicate significant differences (P < 0.05, Kruskal-wallis test). BS, bulk soil; RS, rhizosphere soil; R, root endosphere

