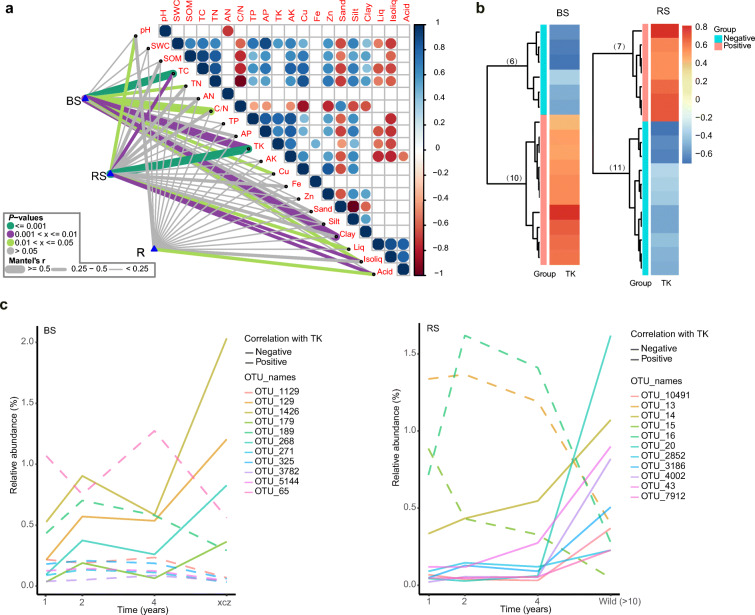
Fig. 5.
(a) Correlation analysis among soil characteristics, root secondary metabolites, and root-associated core-enriched bacterial communities (Bray-Curtis distances) in the three soil–root compartments based on the Mantel test. The color of the line represents the significance of the differences (P-values). The size of the line represents correlation coefficients (Mantel’s r). (b) Correlation heatmaps between TK and the core-enriched OTUs in the bulk and rhizosphere soils. The number of significant correlations is indicated in brackets. (c) Temporal variation curves of individual taxa with significant correlations and temporal variability in the bulk and rhizosphere soils. pH, soil pH; SWC, soil water content; SOM, soil organic matter; TC, total carbon; TN, total nitrogen; AN, available nitrogen; C/N, total carbon/nitrogen ratio; TP, total phosphorus; AP, available phosphorus; TK, total potassium; AK, available potassium; Cu, copper; Fe, iron; Zn, zinc; Liq, liquiritin; Isoliq, isoliquiritin; and Acid, glycyrrhizin. BS, bulk soil; RS, rhizosphere soil; and R, root endosphere

