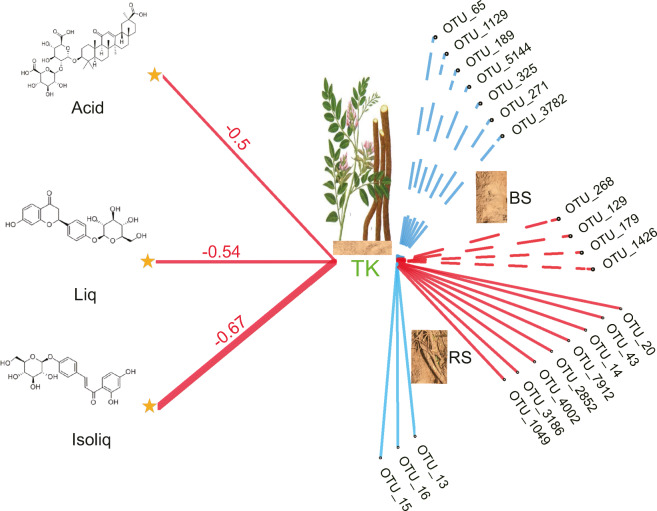
Fig. 6.
Conceptual diagram of total soil potassium (TK) mediating the links between root secondary metabolites in licorice and individual taxa (OTUs) in the bulk soil (BS) and rhizosphere soil (RS). The color of the line represents significantly positive (blue) and negative (red) correlations. The size of line represents correlation coefficients (r). Liq, liquiritin; Isoliq, isoliquiritin; and Acid, glycyrrhizin. Etabolites in licorice

