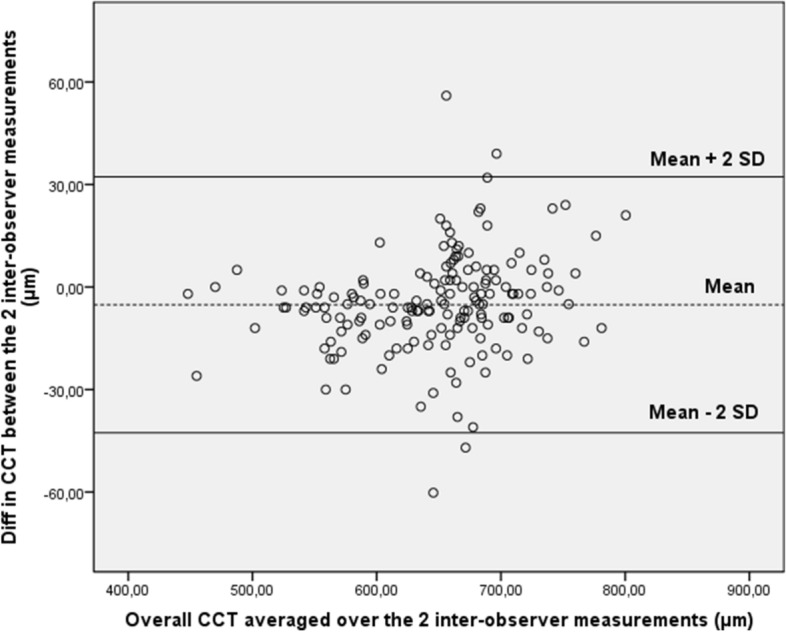
Figure 2.

Bland–Altman plot of reproducibility of central corneal thickness (CCT) measurements obtained by the first observers (n.1 and n.3) and the second observers (n.2 and n.4). Mean central corneal thickness (CCT) for paired inter-observer measurements (obtained by the first operators and the second operators) is plotted against difference in CCT between the two results. Ninety-five percent of the values fell within 2 SDs of the mean.
