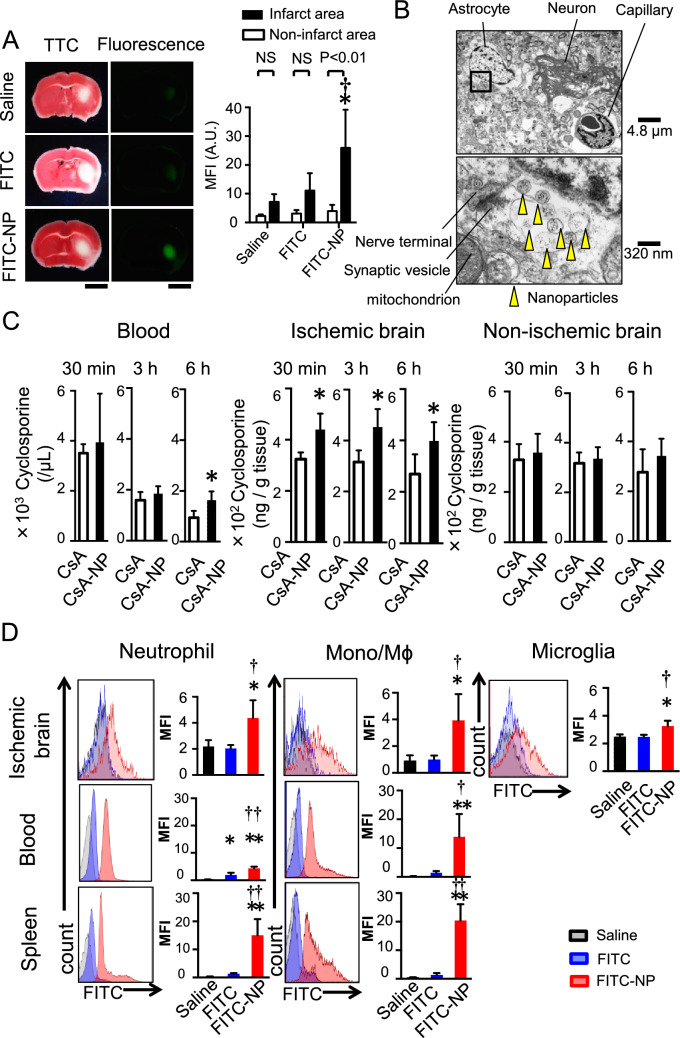
Figure 4.
In vivo distribution of PLGA-NPs after cerebral IR injury. (A) Representative light (left) and fluorescent (right) photographs of cross-sectioned brains 6 h after an intravenous injection of saline, FITC or FITC-NPs. In the light images, the brains were stained with TTC to determine the infarct area. Scale bar: 2 mm. Data are presented as the mean ± SD (N = 4 mice per group). *P < 0.01 versus saline in the infarct area, †P < 0.05 versus FITC in the infarct area according to two-way ANOVA followed by Bonferroni’s multiple comparison tests. (B) Electron microscopic images of ischemic brain tissue 6 h after an intravenous injection of FITC-NPs. Yellow arrowheads indicate nanoparticles. (C) Blood and tissue (ischemic hemisphere, nonischemic hemisphere) concentrations of CsA. Data are presented as the mean ± SD (N = 8 mice per group). *P < 0.05 versus CsA calculated by unpaired t-tests. (D) Flow cytometric analysis of leukocytes isolated from the brain, blood and spleen. Histograms indicate representative data showing the distribution of FITC fluorescence, and bar graphs show quantitative results. MFI: mean fluorescent intensity. Data are presented as the mean ± SD (N = 4–5 mice per group). *P < 0.05 versus saline, **P < 0.01 versus saline, †P < 0.05 versus FITC, ††P < 0.01 versus FITC according to one-way ANOVA followed by Bonferroni’s multiple comparison tests.

