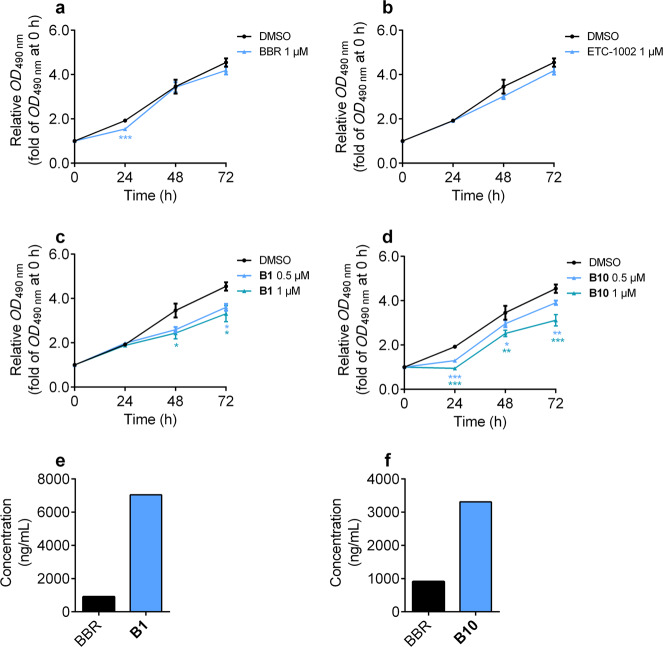
Fig. 2. Anti-proliferative activities and permeability of compounds B1 and B10 on A549 cells.
a–d Relative optical density (OD) value measured at 490 nm on A549 cells after treatment of BBR, ETC-1002, B1 and B10 at 0, 24, 48 and 72 h. All data were shown as mean ± S.E.M of three independent replications. Asterisks indicate P-values (*P < 0.05, **P < 0.01, ***P < 0.001) of control versus treated groups. e, f Permeability experiment performed in A549 cells with 5 μM compounds treatment for 8 h to measure intracellular concentration.

