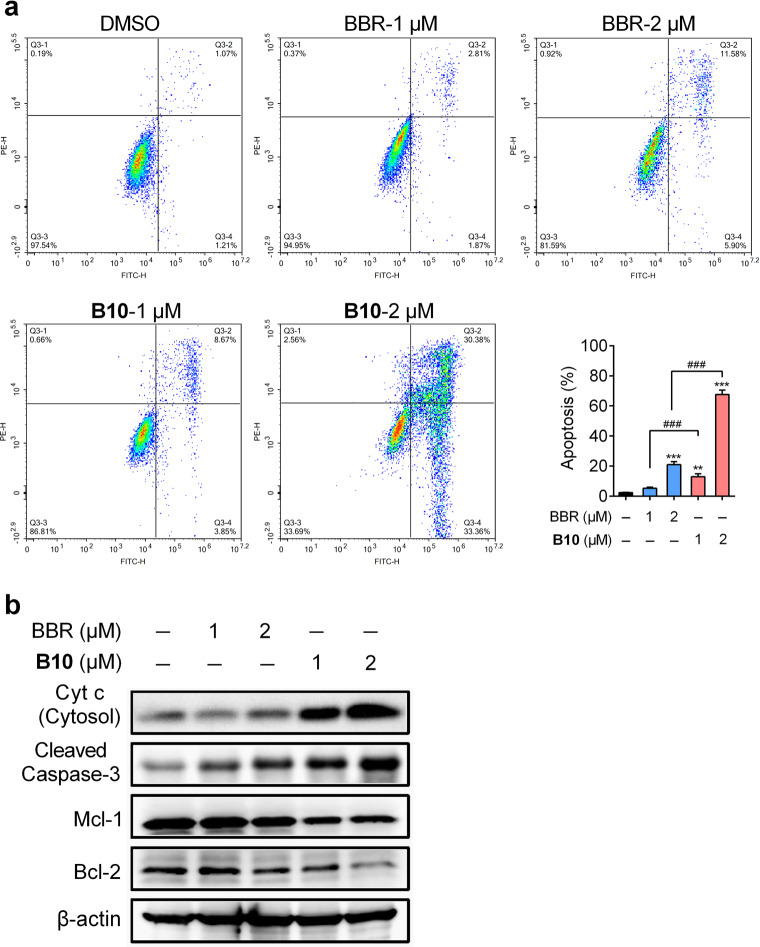
Fig. 6. B10 induced apoptosis in A549 cells.
a Flow cytometry plots of Annexin V/PI assay in A549 cells, following 24 h treatment with BBR or B10. b Immunoblot analysis of A549 cells lysate following 24 h treatment with blank, BBR or B10 for detection of apoptosis-related proteins. All data were shown as mean ± S.E.M. of three independent replications. Asterisks indicate P-values ( **P < 0.01, ***P < 0.001) of control versus treated groups. ###P < 0.001 of BBR versus the same dose of B10.

