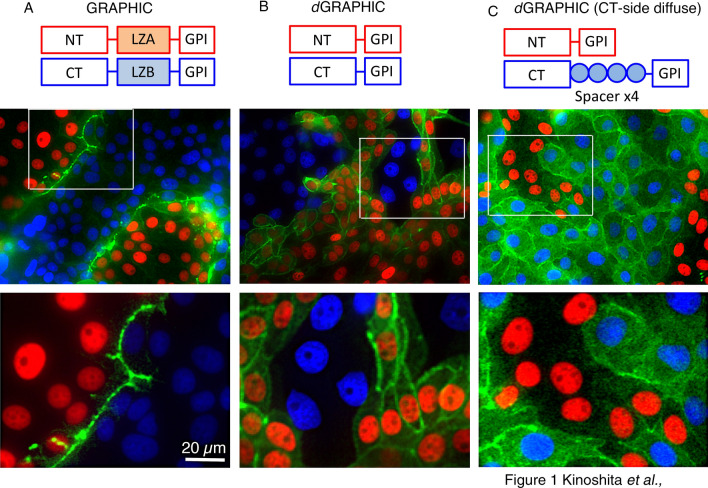
Figure 1.
Distribution of reconstituted GFP is dependent on GRAPHIC probe molecular structure. A red nucleus (labeled by H2B-mCherry) indicates an NT cell, and a blue nucleus (labeled by H2B-Azurite) indicates a CT cell. (A) GRAPHIC: NT probe containing an acidic leucine zipper domain (LZA) and CT probe containing a basic leucine zipper domain (LZB). Reconstituted GFP was observed only at the boundary between NT and CT cells. White box indicates position of higher magnification view. (B) dGRAPHIC: Leucine zipper domain was removed from both NT and CT probes. dGRAPHIC showed almost all reconstituted GFP signals on NT cells, compared with CT cells. (C) A probe pair consisting of NT and CT probes with 3 spacer domains (15 aa × 3) inserted between the GFP-CT fragment and GPI anchor domain. Reconstituted GFP was equally observed on both NT and CT cells. (D) Combination of NT and CT probes with 4 spacer domains (15 aa × 4). Reconstituted GFP was detected predominantly on CT cells. Scale bar, 40 µm and for higher magnification 20 μm.

