Figure 2.
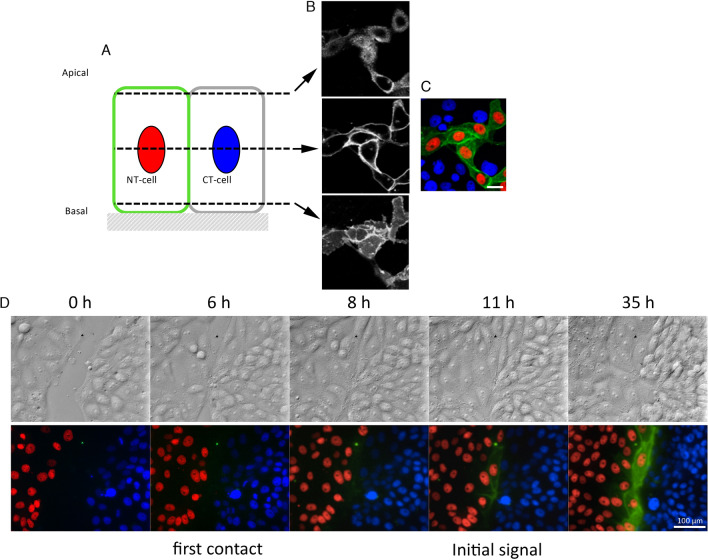
Spatiotemporal characteristics of dGRAPHIC. (A) Confocal images reveal subcellular distribution of reconstituted GFP in co-cultured NT-probe-expressing and CT-probe-expressing LLCPK1 cells. Schema of z-positions of confocal images. (B) Stacked confocal images (z = 1.2 μm) at apical surface (top), middle position (center), and basal membrane (bottom). (C) Full stacked image (z = 7.2 μm) of reconstituted GFP, nuclei of NT-cells (red), and nuclei of CT-cells (blue). Scale bar, 20 µm. (D) Time lapse images for the generation of reconstituted GFP signal between NT-LLCPK1 cells (red nuclei) and CT-LLCPK1 cells (blue nuclei). Upper panels are bright field (differential interference contrast) images of the bottom fluorescence images. The reconstituted GFP signal was generated at cell–cell contact sites and gradually spread out over the whole plasma membrane of contacted NT cells (red nuclei). Scale bar, 100 μm.

