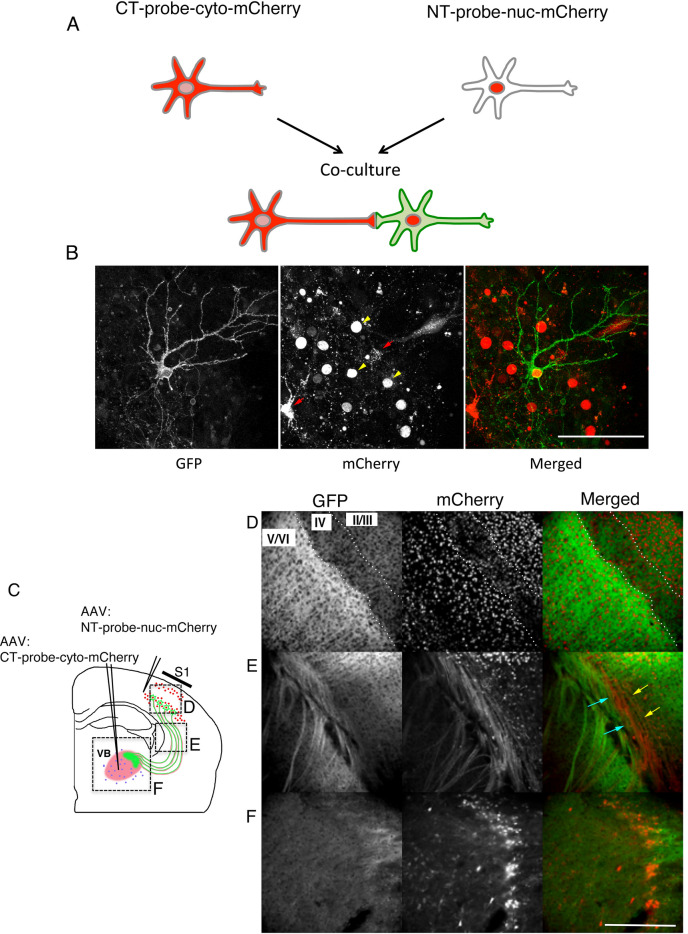
Figure 4.
dGRAPHIC labels neurons in vitro and in vivo. (A) Experimental schema for in vitro dGRAPHIC. Each probe plasmid was electroporated into hippocampal neurons in individual cuvettes, and electroporated neurons were mixed and co-cultured. NT neurons show red fluorescence only in the nucleus and CT neurons show red fluorescence throughout the cell. (B) Reconstituted GFP in hippocampal cultures. In co-cultured hippocampal neurons, the reconstituted GFP signal was observed only in NT neurons (yellow arrows), which was equally distributed on soma, dendrites, and axons. No GFP signal was present in CT neurons (red arrows). Scale bar, 100 μm. (C) Experimental schema for in vivo dGRAPHIC. AAVs encoding NT probes (co-expression with red fluorescent nuclear label) and CT probes (co-expression with cytosolic mCherry) were stereotaxically injected into the S1 cortex and VB, respectively. After several weeks, the injected brains were sectioned and observed. (D–F) In coronal sections, the GFP and mCherry signals were observed in the cortex (D), white matter (E), and VB thalamus area (F). Scale bar, 500 μm.

