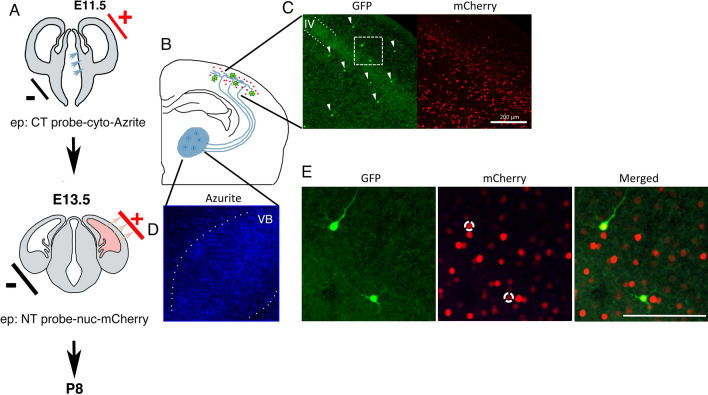
Figure 6.
Visualization of past thalamocortical connections in the developing mouse brain. (A) Experimental schema. In utero electroporation in the ventricular zone of diencephalon (developing thalamus, blue arrows) was performed at E11.5 to express the CT probe (co-expressed with blue fluorescent nuclear label). Two days later, in utero electroporation in the ventricular zone of telencephalon (pink arrows) was performed at E13.5 to express the NT probe (co-expressed with red nucleus label) in cortical layer IV. (B) Schema of thalamocortical axon projections to cortical layer IV in adult brain. (C) GFP and mCherry images of the cortical S1 area. Scattered GFP signals are not restricted to layer IV but observed in several cortical layers (white arrowheads). Scale bar, 200 μm. (D) CT-probe expression in VB was observed by a blue nuclear signal. (E) Higher-magnification images of white dotted box in C. Dotted white circles in mCherry image indicate nuclei of GFP-positive neurons. Scale bar, 100 μm.

