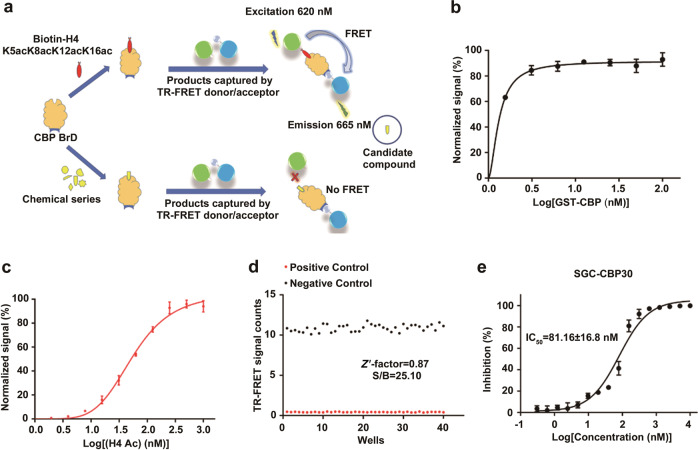
Fig. 1.
The establishment and evaluation of the TR-FRET assay. a The schematic diagram of the TR-FRET assay. b TR-FRET saturation-binding curves with increasing concentrations of GST-CBP BrD. c TR-FRET saturation-binding curves with increasing concentrations of lysine-acetylated H4 peptide. d Evaluation of Z′ factors for the high-throughput screening assay in the absence or presence of 0.25% DMSO. e IC50 determination for SGC-CBP30 against CBP BrD. All experiments were performed at least three times. The data were analyzed in GraphPad Prism 7.0

