Fig. 5.
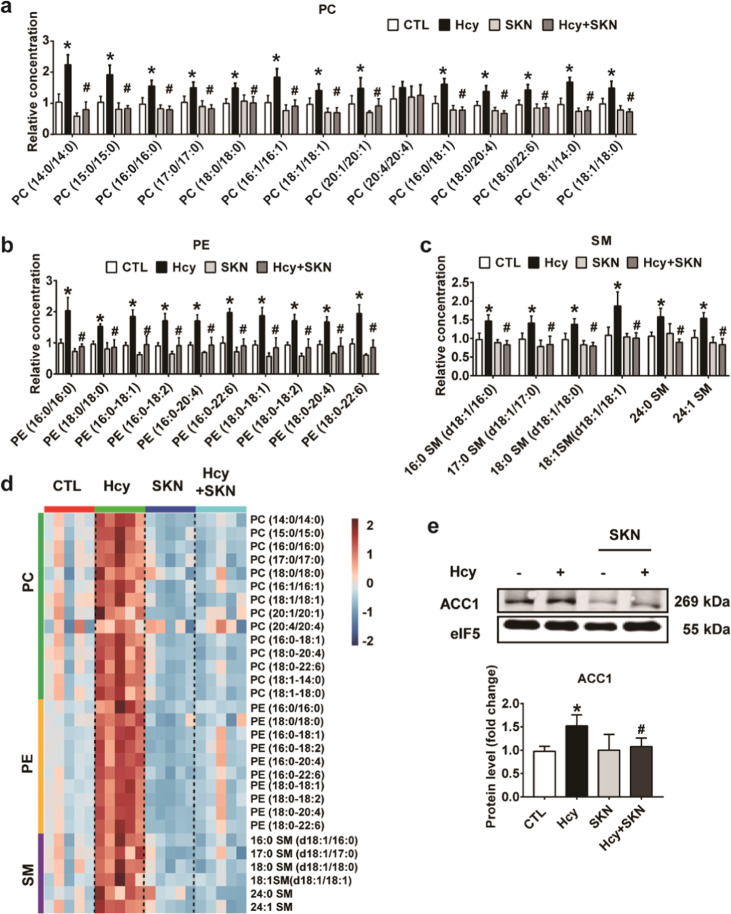
SKN inhibits the Hcy-induced activation of the glycolytic-lipogenic axis in CD4+ T cells. Splenic CD4+ T cells were treated with or without SKN (0.2 μM) for 30 min and then stimulated with or without Hcy (100 μM) in the presence of anti-CD3 (1 μg/mL) for 24 h, following which T cell lysates were extracted and analyzed for cellular lipids using LC-MS/MS. Relative levels of the phospholipids PC (a), PE (b), and SM (c) are shown (n = 5). d Heat map showing an overview of lipidomic alterations (n = 5). e The protein level of ACC1 was detected by western blotting (n = 7). The data are shown as mean ± SD. One-way ANOVA followed by Tukey’s test was used for multiple comparisons. *P < 0.05 compared with the CTL group; #P < 0.05 compared with the Hcy group

