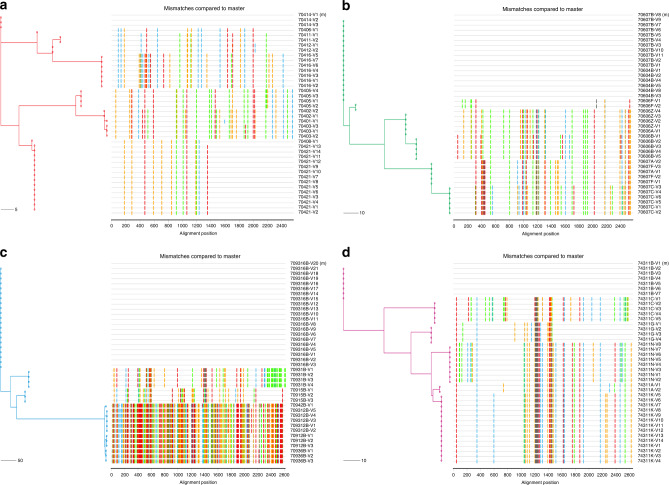
Fig. 4. Distinct circulating viral variants in infant elite neutralizers.
a–d Highlighter plots with maximum-likelihood trees of 40 SGA env sequences from each infant suggests productive infection with more than two distinct viruses. Maximum-likelihood trees are color coded (AIIMS704—red, AIIMS706—green, AIIMS709—blue and AIIMS743—deep pink). Colored hash marks on each highlighter plot represent nucleotide difference (A—green; T—red, C—blue, and G—orange) compared to the sequence at the top of the plot. The horizontal scale bar represents genetic distance. nt, nucleotide.

