
Fig. 3. ADSC treatment reversed CMS-induced inflammatory factor expression and hippocampal microglial activation.
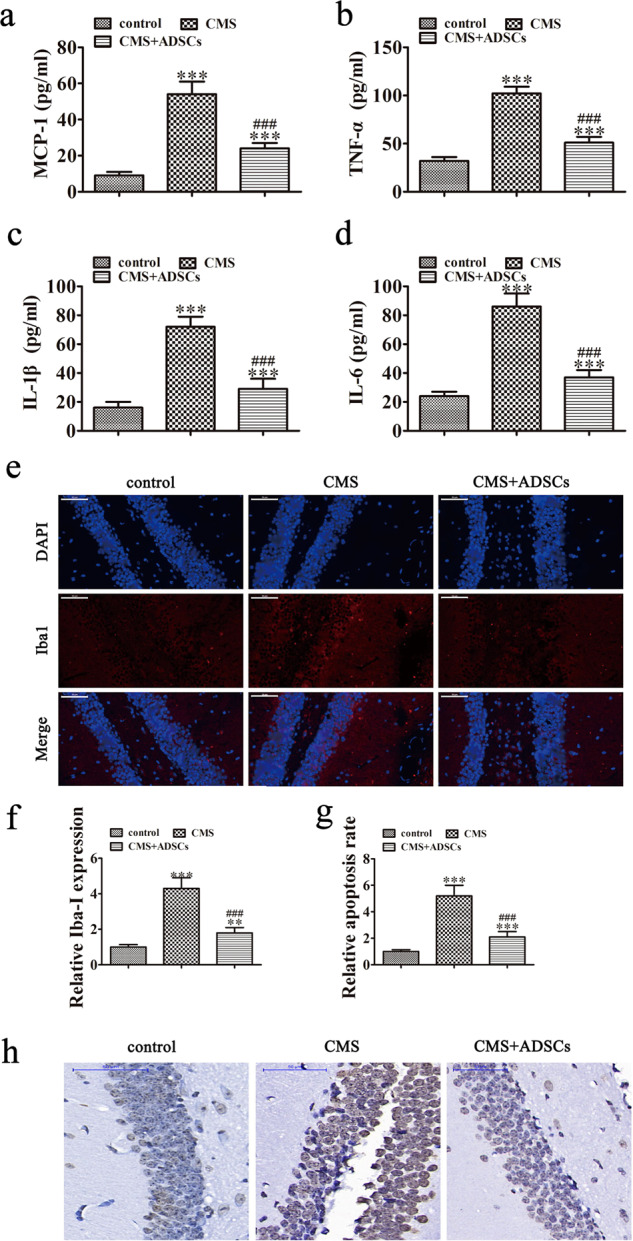
a–d ELISA analysis showing the expression of the inflammatory factors MCP-1, TNF-α, IL-1β, IL-6 in the serum. The data are expressed as the mean ± SEM (n = 10). ***P < 0.001 vs control. ###P < 0.001 vs CMS. e, f Representative images showing that ADSC treatment decreased the number of Iba1+ microglia compared with that in the CMS mice. The data are expressed as the mean ± SEM (n = 6). **P < 0.01, ***P < 0.001 vs control; ###P < 0.001 vs CMS. g, h Immunohistochemical detection of apoptotic hippocampal neurons. The data are expressed as the mean ± SEM (n = 10). ***P < 0.001 vs control; ###P < 0.001 vs CMS. Scale bar: 50 μm.