Fig. 6.
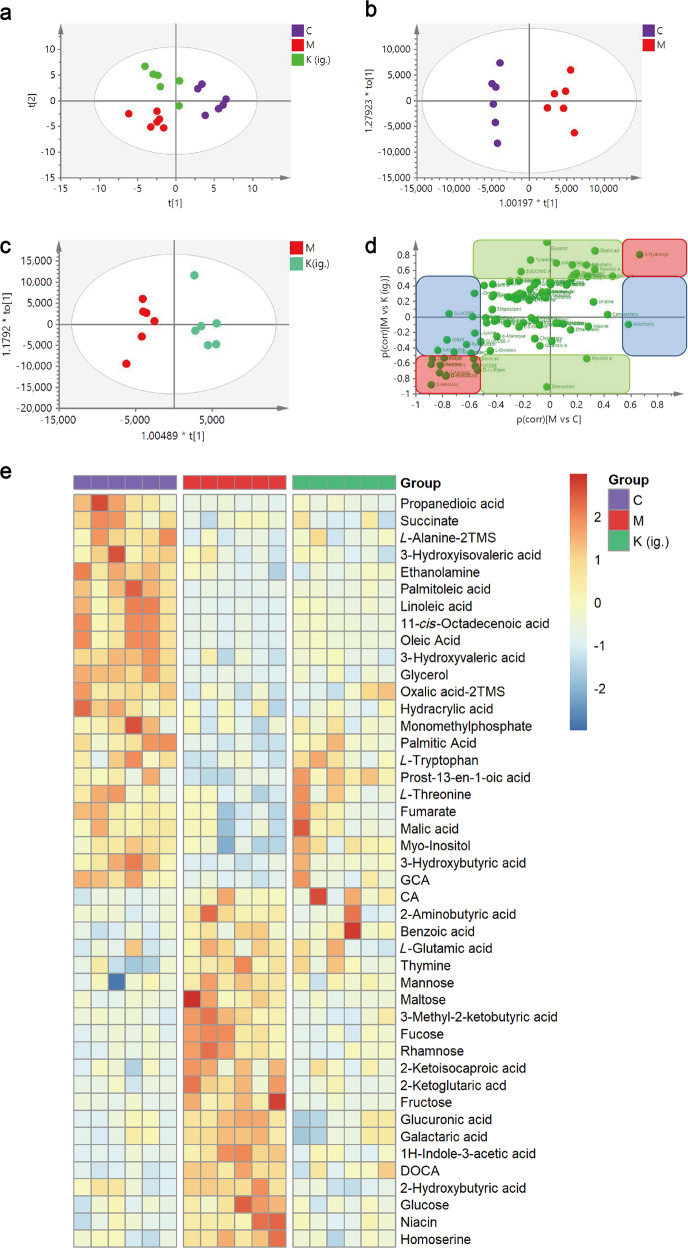
Kaempferol treatment modulates the metabolites in fecal samples of CIA mice. Metabolic patterns of the three groups of mice based on the multivariate statistical analysis of the GC/MS data. a The score plots of the three groups and their PLS-DA models for fecal data; b CIA vs. normal groups and their OPLS-DA models for fecal data; c kaempferol treatment vs. CIA treatment and the OPLS-DA for fecal data; d SUS plot of fecal samples correlating the OPLS-DA models of CIA versus the control (x-axis) and CIA versus kaempferol treatment (y-axis). Accordingly, the variables in the lower left corners and higher right corners are the compounds whose levels were reversed after kaempferol treatment of CIA mice (red box). However, metabolites located along the axes were specifically altered in the model group (blue boxes) and the normal group (green boxes). e Heatmap visualizing the intensities of differential metabolites in the fecal samples (n = 6). C: control, M: model, K (ig.): oral administration of kaempferol

