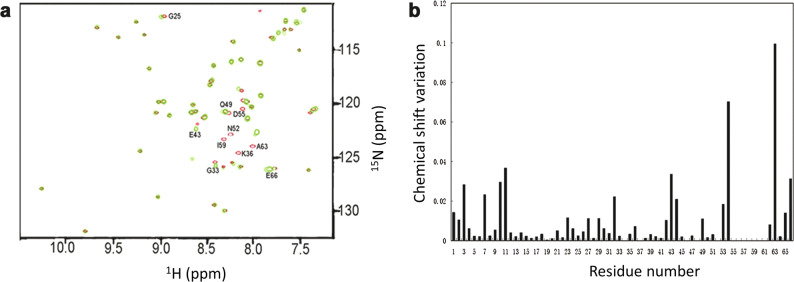
Fig. 1. The interaction between thrombin and RGD-hirudin.
a Overlay of 1H-15N HSQC spectra of RGDhirudin in the absence (shown in red) and presence of thrombin (shown in green). Thrombin was titrated into RGD-hirudin at a molar ratio of 1.2:1. Both spectra are plotted at the same signal-to-noise level. b Weighted CSPs are plotted versus the amino acid sequence upon titration of RGD-hirudin with thrombin. Most residues with Δδ ≥ 0.01 ppm or missing residues are located on the N-terminus (1–10) and C-terminus (53–66) of RGD-hirudin.

