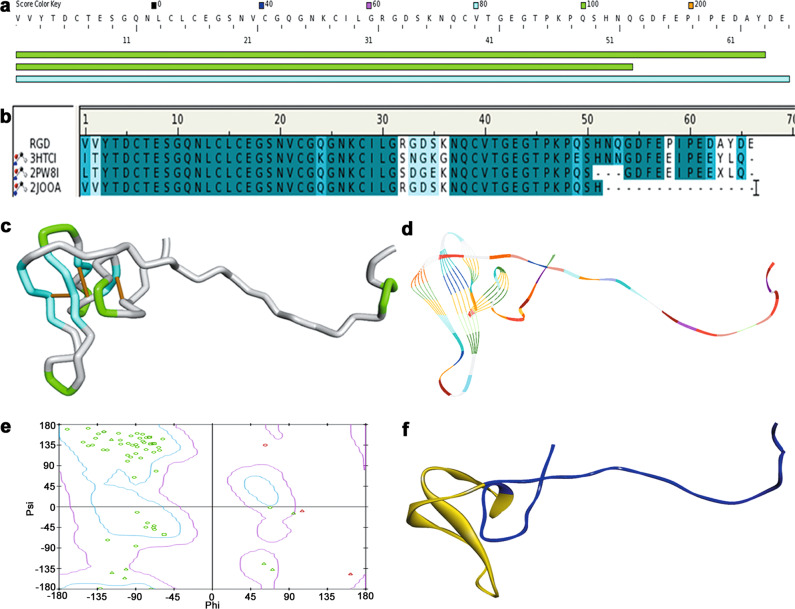
Fig. 2. Molecule simulation of RGD-hirudin.
a Similar sequences with RGD-hiudin in the DS server database. b Amino acid sequence alignment of RGD-hirudin with recombinant hirudin (PDB ID: 3HTCI), sulfo-hirudin (PDB ID: 2PW8I), and recombinant RGD-hirudin (PDB ID: 2JOOA). Same amino acid residues are shown in dark blue, while similar amino acid residues are shown in light blue. c Homology modeling of RGD-hiudin in a tube format. d Homology modeling of RGD-hirudin in a line ribbon format. e Ramachandran plot of the RGD-hirudin model. The distribution of the RGD-hirudin residues (green ring) are shown in colors: allowed region (within light blue), marginal region (beyond light blue and within pink) and disallowed region (beyond pink). The percent of residues in allowed the region was 90.2%, in the marginal region 7.8%, in the disallowed region 2.0%. Phi is represented by a peptide alpha carbon left C–N bond rotation angle, and psi is shown as a peptide alpha carbon on the right side of the C–C bond rotation angle. f Homology modeling of RGD-hirudin in a flat ribbon format (blue) and the fragment from Leu15 to Thr45 (yellow).

