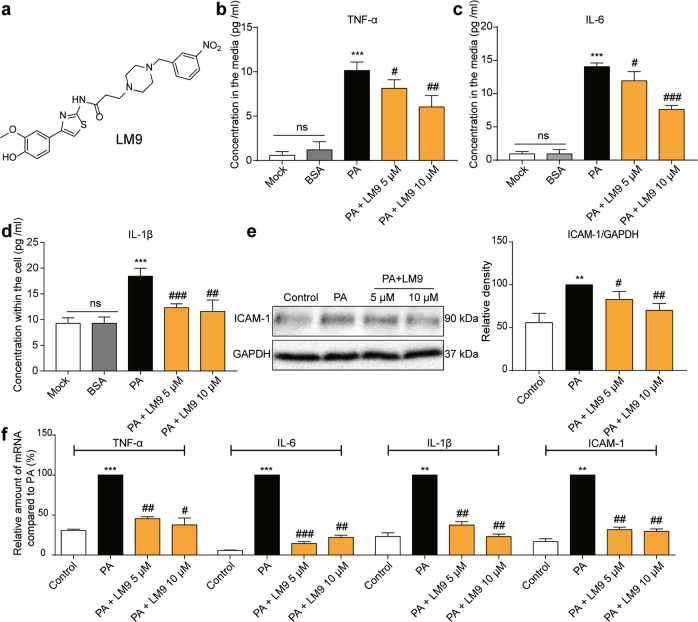
Fig. 1. LM9 attenuates PA-induced inflammation in mouse peritoneal macrophages.
a The chemical structure of LM9. Effects of LM9 on TNF-α (b), IL-6 (c), and IL-1β (d) production. The concentrations of TNF-α and IL-6 in supernatants from MPMs that were treated with various doses (above the lanes) of LM9 followed by stimulation with 200 μM PA for 24 h were measured by ELISA. The data are expressed as the mean ± SD (n = 3). Student’s t test was utilized for the statistical analysis, and significant differences are indicated as * or #. *P < 0.05, **P < 0.01, and ***P < 0.005 vs. the BSA-treated group; #P < 0.05, ##P < 0.01, and ###P < 0.005 vs. the PA alone group. e The protein level of ICAM-1 in MPMs was determined by Western blot assay (n = 3). f MPMs were pretreated with LM9 (5 and 10 μM) for 1 h and stimulated with 200 μM PA for 12 h, after which TNF-α, IL-6, IL-1β, and ICAM-1 mRNA levels were determined by qRT-PCR. The data are expressed as the mean ± SD (n = 3). Student’s t test was utilized for the statistical analysis, and significant differences are indicated as * or #. **P < 0.01, and ***P < 0.005 vs. the control group; #P < 0.05, ##P < 0.01, and ###P < 0.005 vs. the PA alone group.

