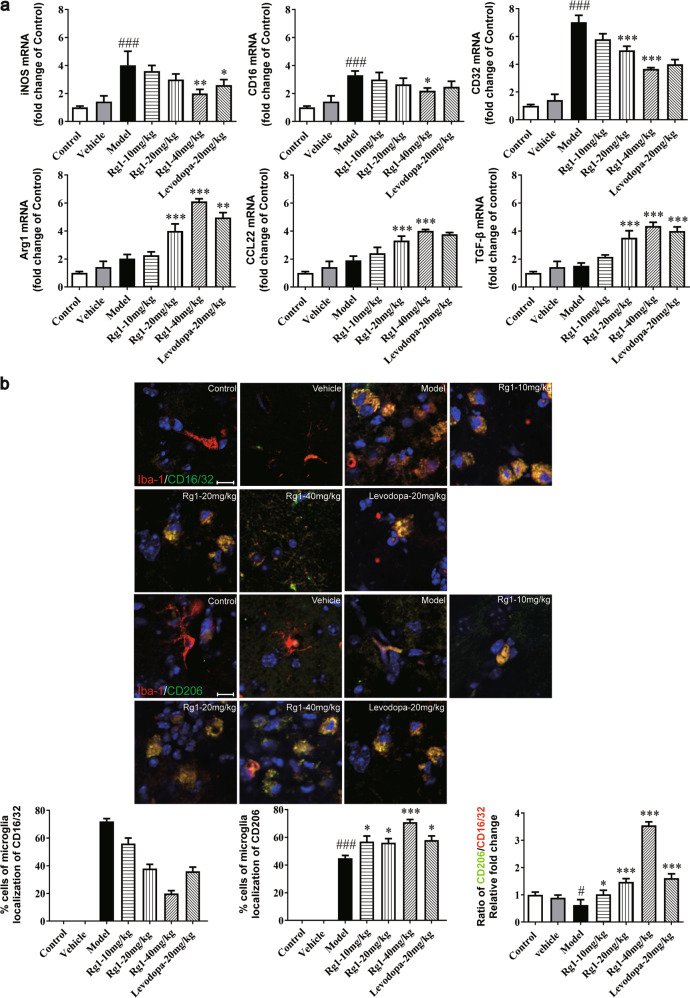
Fig. 6.
Rg1 regulated the M1 and M2 activation states. a qPCR analysis of mRNA expression of M1 markers (iNOS, CD16, CD32) and M2 markers (Arg1, CCL-22, TGF-β) in the midbrain of LPS-PD mice. b Representative photomicrographs of double-staining immunofuorescence of CD16/32 with Iba-1 and CD206 with Iba-1 in the midbrain of LPS-induced PD mice. Quantitative analysis of CD16/32-positive and CD206-positive microglia in the midbrain (scale bar = 10 μm). All data were presented as mean ± SD of triplicate independent experiments. #P < 0.05, ###P < 0.001 vs. vehicle group; *P < 0.05, **P < 0.01, ***P < 0.001 vs. model group

