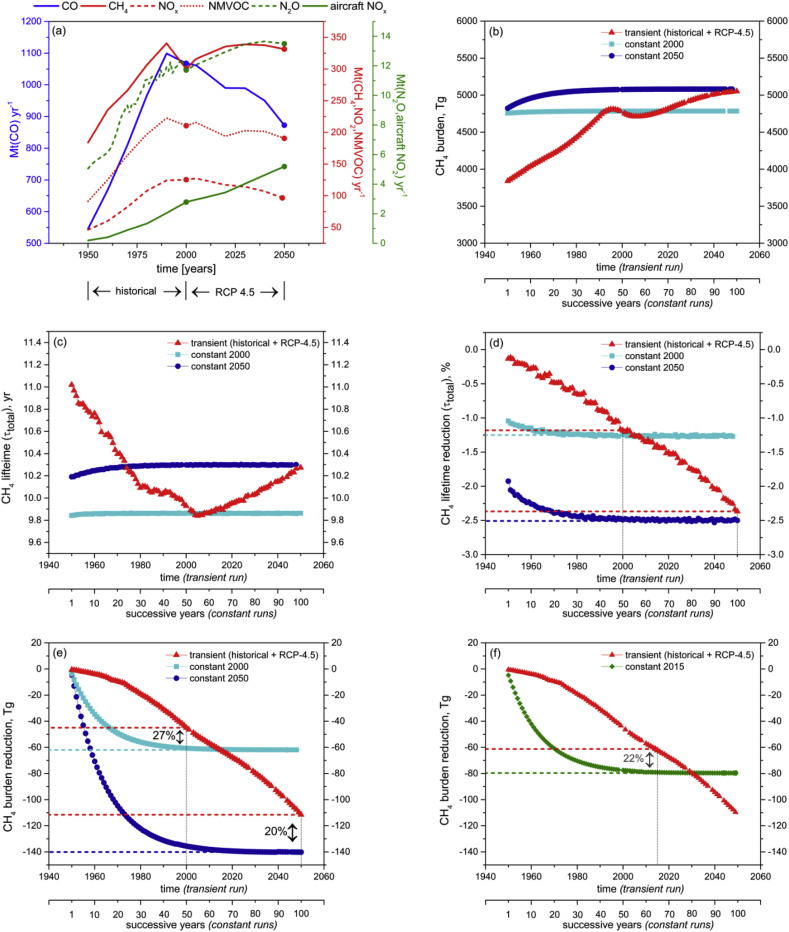
Fig. D.2.
(a) Past and future anthropogenic emissions of CO, CH4, NOx, NMVOC, N2O and aircraft NOx (IIASA RCP Database: http://www.iiasa.ac.at/web-apps/tnt/RcpDb/). Dots represent conditions for ‘constant 2000’ and ‘constant 2050’ simulations. (b) Evolution of the global CH4 burden in TROPOS for transient aircraft NOx emissions combining historical emissions (1950–2000) and RCP-4.5 emissions (2000–2050); and constant emissions for the years 2000 and 2050. (c) Global CH4 lifetime due to aircraft NOx emissions in TROPOS for transient emissions combining historical emissions (1950–2000) and RCP-4.5 emissions (2000–2050); and constant emissions for the years 2000 and 2050. (d) Global CH4 lifetime reduction due to aircraft NOx emissions in TROPOS for transient emissions combining historical emissions (1950–2000) and RCP-4.5 emissions (2000–2050); and constant emissions for the years 2000 and 2050. The dashed lines represent 2000 and 2050 equilibrium values (light and dark blue) and 2000 and 2050 transient values (red). (e) Global CH4 burden reduction due to aircraft NOx emissions in TROPOS for transient emissions combining historical emissions (1950–2000) and RCP-4.5 emissions (2000–2050); and constant emissions for the years 2000 and 2050. The dashed lines represent 2000 and 2050 equilibrium values (light and dark blue) and 2000 and 2050 transient values (red). (f) Global CH4 burden reduction due to aircraft NOx emissions in TROPOS for transient emissions combining historical emissions (1950–2000) and RCP-4.5 emissions (2000–2050); and constant emissions for the year 2018. The dashed lines represent 2018 equilibrium (green) and transient values (red).

