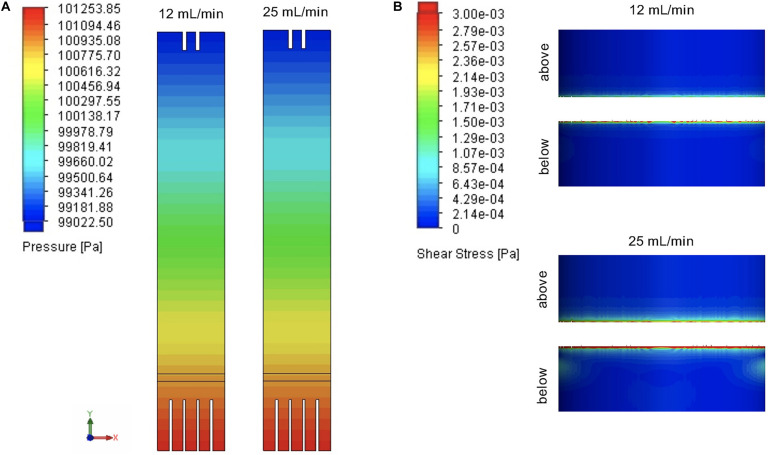
FIGURE 3.
Fluid pressure and shear stress profiles in the small-scale fluidized bed bioreactor (sFBB). (A) Pressure cut plots of the middle plane of sFBB at inlet and (B) flow shear stress surface plots on the inner wall of the bioreactor focused on the distributor region (below and above the distributor). Simulations were computed for inlet flow rates of 12 and 25 mL/min. Values are presented in Pa.

