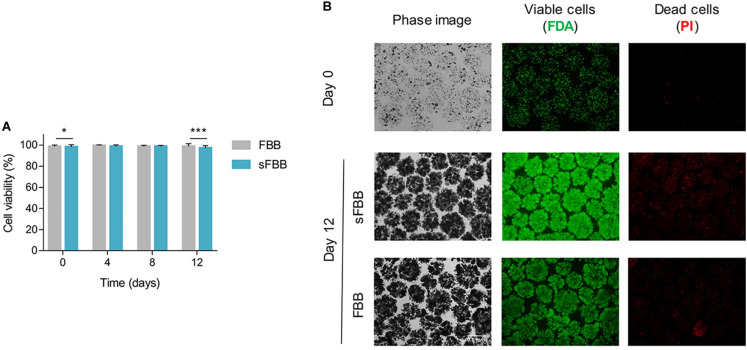
FIGURE 8.
Cell viability in the small-scale fluidized bed bioreactor (sFBB). (A) Cell viabilities of alginate encapsulated HepG2 cells throughout 12 days of culture analyzed for the sFBB and compared to the clinical scale FBB. Data presented are average ± standard deviation (SD) (n = 17 for FBB and n = 7 for sFBB). Statistical analysis assessed by multiple Student’s t-test. ***p < 0.001. (B) Cell bead morphology (phase image) and viability (live cells – FDA, dead cells – PI) images at 10× magnification from days 0 and 12.

