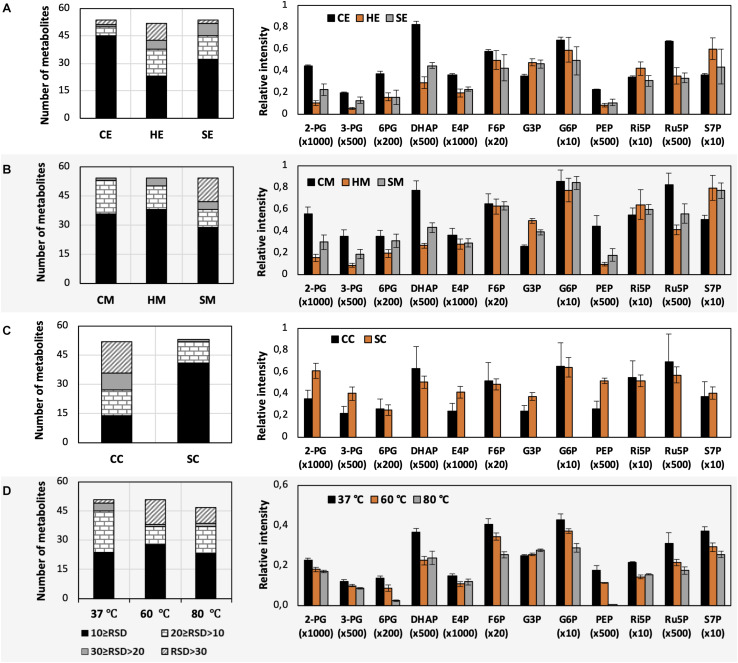
FIGURE 3.
Impacts of different extraction and derivatization conditions on U. maydis intracellular metabolites. RSD values and the levels of phosphorylated metabolites extracted with (A) EtOH, (B) MeOH, and (C) chloroform/MeOH/water; as well as (D) derivatized under different temperatures. Each data point represents the average of three biological replication with the error bar indicating the standard deviation. Normalized peak intensities of some metabolites were multiplied for data visualization.

