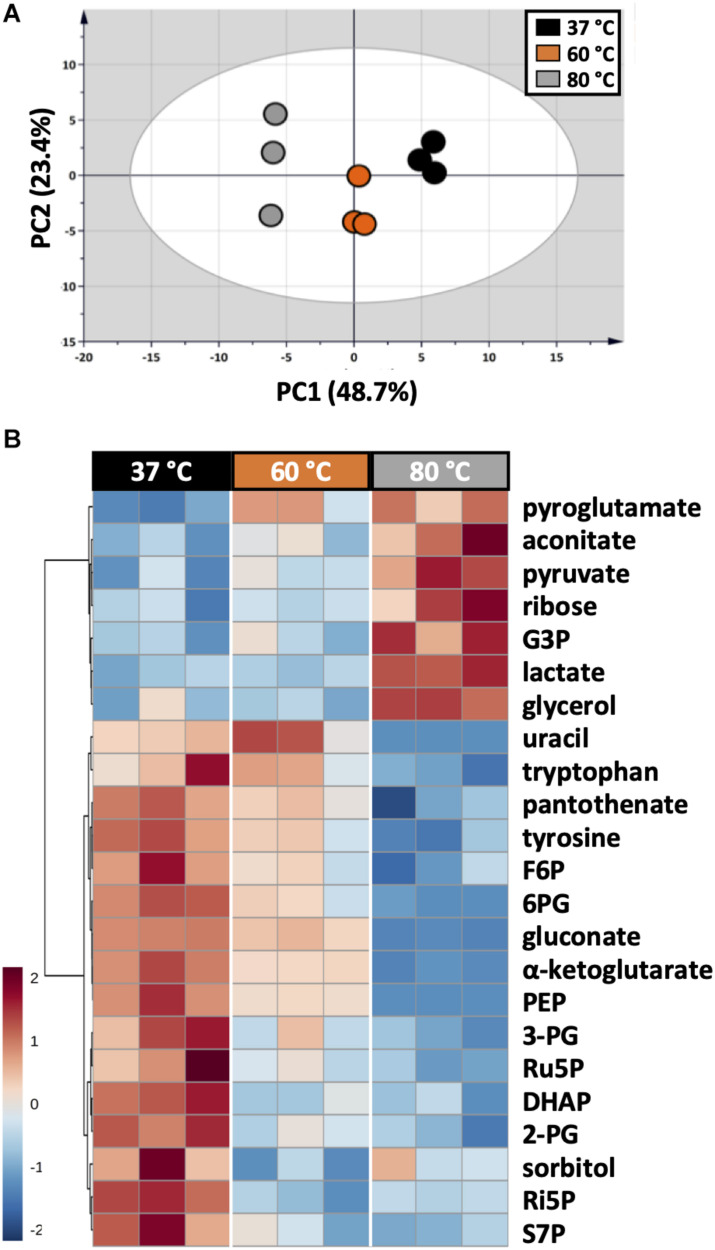
FIGURE 5.
Impacts of different derivatization conditions on U. maydis intracellular metabolites. (A) PCA score plot acquired from the complete dataset. (B) HCA heatmap of metabolites with adjusted p-value < 0.05 from one-way ANOVA test. Each experiment had three biological replicates and UV scale was applied before statistical analyses. The color scale in HCA indicates relative intensity after normalization and scaling.

