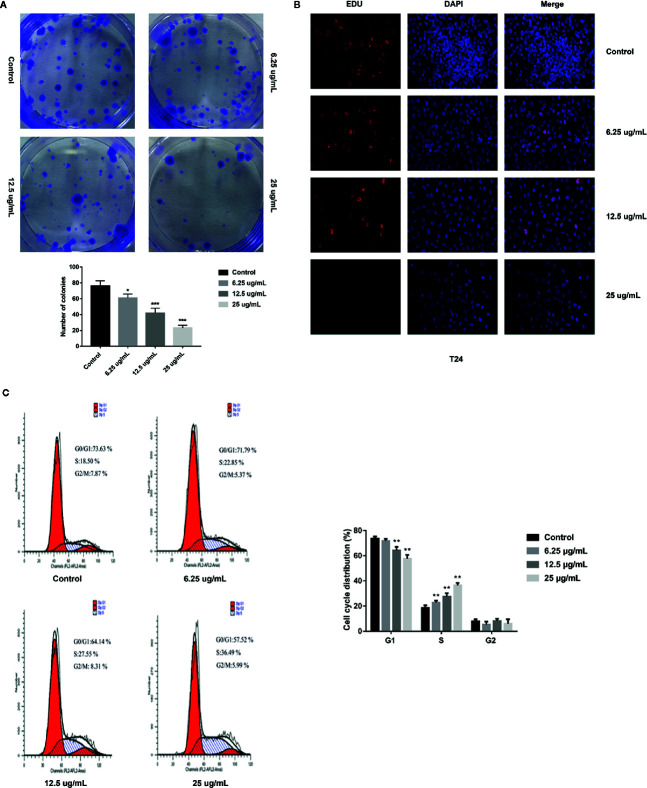
Figure 2.
GA affected T24 cells proliferation and cells cycle distribution. (A) Representative images and quantitative analyses of T24 cell colonies in each group were displayed according to the plate cloning assays. (B) Representative fluorescent images of proliferating T24 cell nuclei were shown by EdU staining (200× magnification). (C) Representative images and quantitative analyses of T24 cell cycle status were assessed by flow cytometry. * p < 0.05, ** p < 0.01, *** p < 0.001, compared to the control group.

