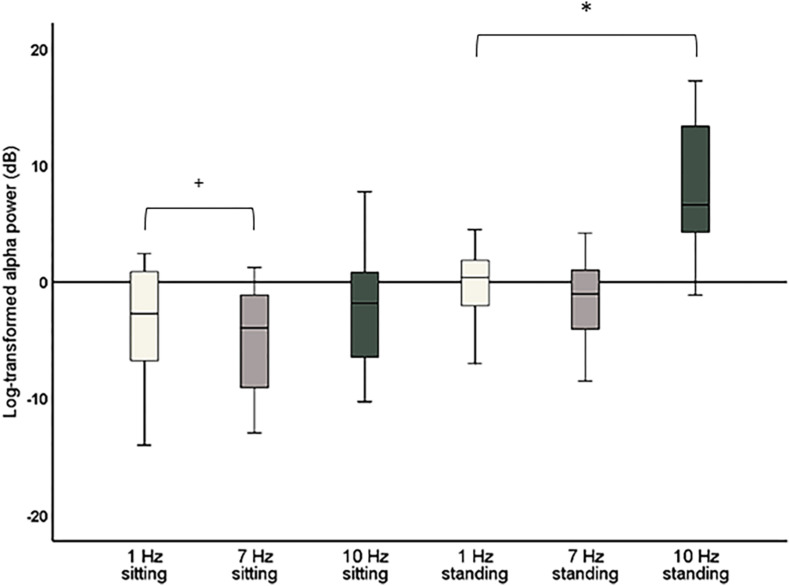
FIGURE 4.
Boxplots of global alpha power (8–12 Hz) during 1 Hz, 7 Hz, and 10 Hz visual stimulation standardized against their respective baseline period, i.e., the change in global alpha power during stimulation compared to baseline. Significant effects after correction for multiple comparisons are marked with *. Effects that did not survive corrections for multiple comparisons but had a p < 0.05 are marked with +.

