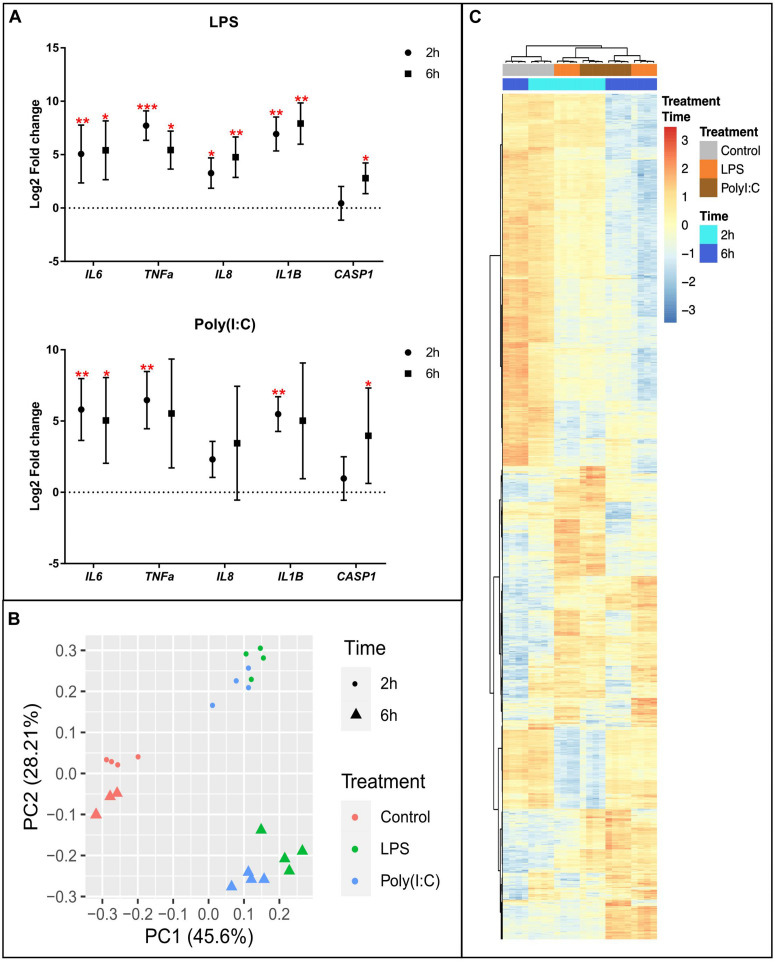
FIGURE 1.
Transcriptional response of alveolar macrophages to LPS or Poly (I:C). (A) QPCR results of inflammatory marker genes in AM stimulated with LPS and Poly (I:C). Data are shown as the mean of Log2 Fold change +/–SD (n = 8). Kruskal-Wallis-one-way ANOVA was used to compare treatments with non-stimulated AM. Significance was set at P < 0.05. *P < 0.05, **P < 0.01, ***P < 0.001, ****P < 0.0001, see Supplementary Table S2 for details. (B) Principal component analysis of transformed RNA-seq reads counts for whole transcriptomes. Axis indicate component scores (C) Heatmap showing DEG between non-stimulated and LPS or Poly(I:C) stimulated AM at 2 and 6 h. Color code is based on Z-score of log2 transformed CPM across all samples. Genes, treatments and timepoints were hierarchically clustered (row, genes; columns, treatments and timepoints).

