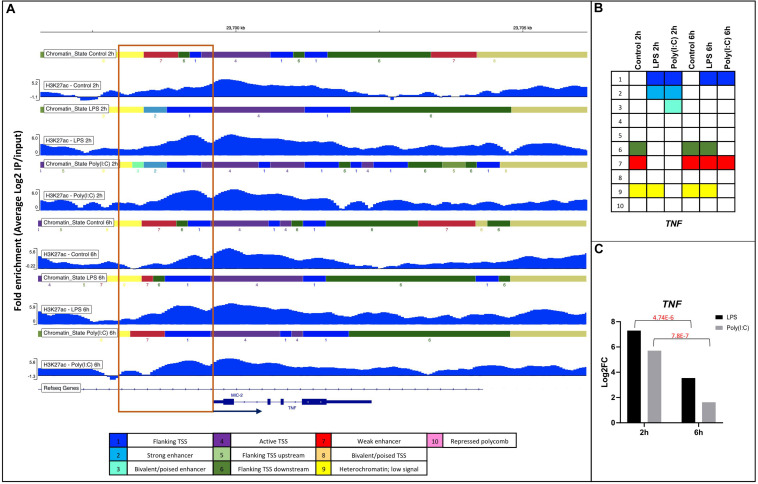
FIGURE 6.
Changes in chromatin state of the TNF gene in response to LPS and Poly(I:C) at 2 h and 6 h. (A) IGV screenshots showing DHMRs-H3K27ac with chromatin states around 1kb of promoter regions of TNF gene in respond to treatments. Annotation of the chromatin states is shown as legend on the bottom and as (B) summary table. (C) Gene expression values of TNF gene from RNA-seq of stimulated AM.

