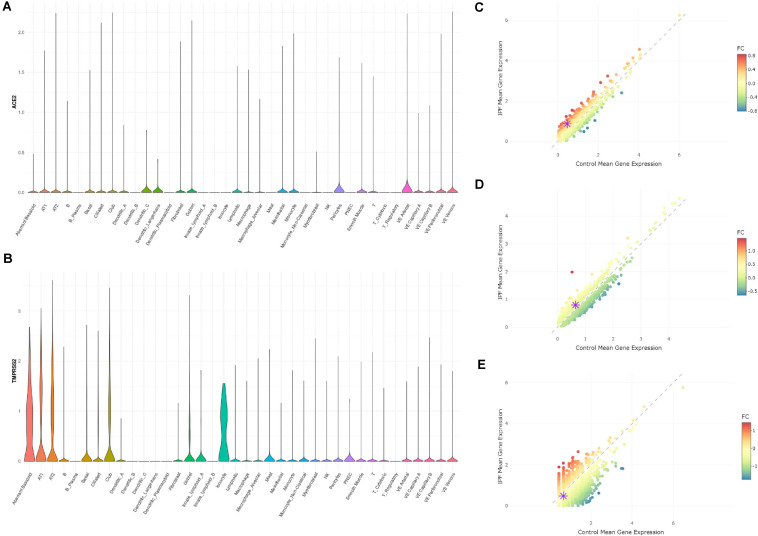
FIGURE 2.
Expression profiles of ACE2 and TMPRSS2 in IPF lung tissues (Adams dataset) (A) Expression profile of ACE2 in the cell types annotated by authors. (B) Expression profile of TMPRSS2 in the cell types annotated by authors. (C) Comparison of TMPRSS2 expression between IPF and healthy groups in cell type AT1 (upregulated in IPF by 1.89-fold). (D) Comparison of TMPRSS2 expression between IPF and healthy groups in cell type AT2 (upregulated in IPF by 1.23-fold). (E) Comparison of TMPRSS2 expression between IPF and healthy groups in cell type ionocytes (downregulated in IPF by 0.72-fold).

