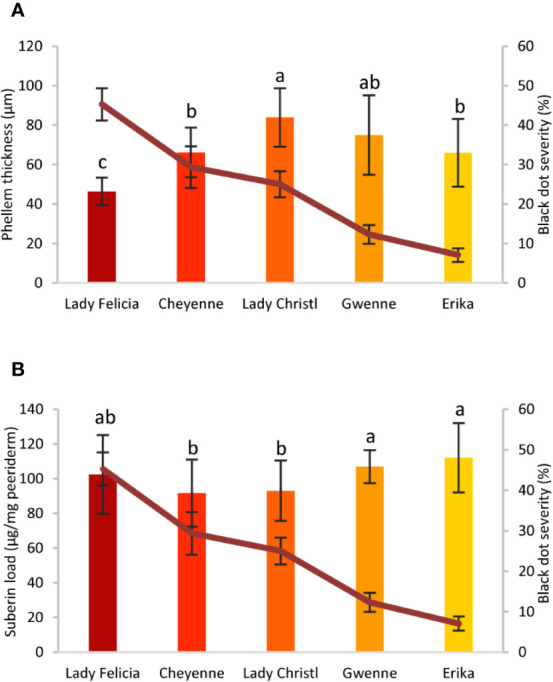
Figure 4.

Phellem thickness and suberin concentration of five potato cultivars with different quantitative resistance to black dot. (A) Phellem thickness (µm) measured in semithin sections of asymptomatic regions of a potato tuber grown in the field of five cultivars (n=12, mean ± Standard Deviation). (B) Total suberin amounts (µg/mg periderm) of five potato cultivars grown under controlled conditions in the absence of the fungal pathogen (n=6). Statistically significant differences in phellem thickness or suberin load are indicated by different letters (p < 0.01, Fisher’s LSD). In all graphs, black dot severity is shown in a red line and its axis on the right.
