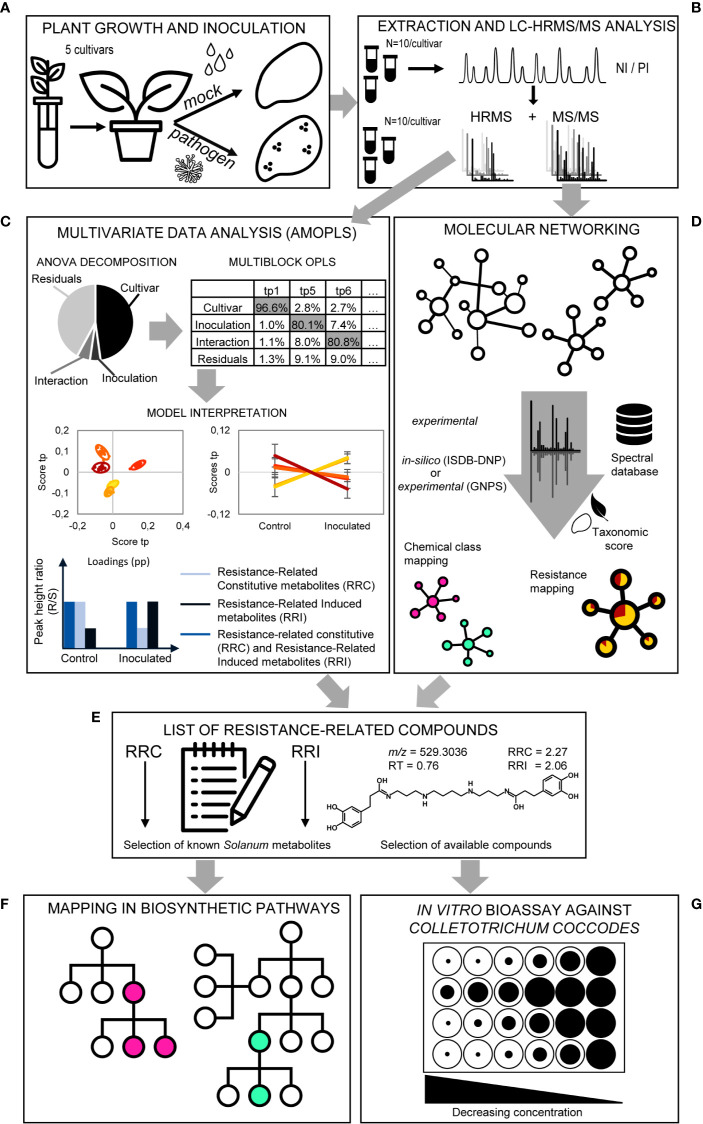
Figure 5.
Overview of the metabolomics strategy. (A) Plant growth and inoculation. Potato plantlets of the five studied cultivars are grown in vitro and transferred to the greenhouse in pots using sterilized soil to avoid fungal infection. Half of the population is mock inoculated, while the other half is inoculated with C. coccodes. (B) Extraction and LC-HRMS/MS analysis. Methanolic extraction of specialized metabolites is followed by LC-HRMS/MS (data-dependent mode) analysis in both negative ionization (NI) and positive ionization (PI) modes. (C) Multivariate Data Analysis (AMOPLS). All features detected in full scan MS are analyzed using an AMOPLS model. ANOVA decomposition of the matrix in submatrices allows assessing the relative variability of each effect (i.e., cultivar, inoculation, interaction, and residuals) by computing the sum of squares of the submatrices. This is followed by a multiblock OPLS model, the predictive components of which explain one of the effects (see Supplementary Table 2). AMOPLS separates the sources of variability related to the experimental factors with dedicated predictive score (tp) and loading values (pp) that are used for the model interpretation. Predictive scores (tp) highlight sample groupings (i.e., cultivar, see Figure 6) or trends (i.e., upon inoculation, see Figure 9) and loadings (pp) highlight induced molecules with respect to the different experimental factors to evidence Resistance-Related metabolites. (D) Molecular Networking. Features possessing MS/MS spectra are used to build a Molecular Network (MN) based on spectral similarity. Features are then annotated by spectral comparison with experimental (GNPS) or in silico (ISDB-DNP) spectral databases. In silico annotations are re-ranked using taxonomic proximity information. Color of individual clusters of the MN are set according to the most abundant chemical class found in the cluster (consensus chemical class) or the relative intensity in resistant and susceptible cultivars (see Figure 7). (E) List of Resistance-Related compounds. A combination of the AMOPLS data analysis and the MN visualization is used to build a list of Resistance-Related metabolites, Constitutive (RRC) or Induced (RRI), with their annotations, and sorted according to their RRC or RRI scores (see Supplementary Table 3). (F) Mapping in biosynthetic pathways. A selection of Resistance-Related annotated metabolites previously reported in the Solanaceae family are placed in their biosynthetic pathways according to the Kyoto Encyclopedia of Genes and Genomes (KEGG) for Solanum tuberosum (or related plant species, if not available for S. tuberosum) to highlight putatively induced or repressed biochemical pathways (see Figure S6). (G) In vitro bioassay against Colletotrichum coccodes. A selection of highlighted Resistance-Related metabolites, commercially available pure compounds, are tested in an in vitro bioassay against C. coccodes using the food-poisoning method at decreasing concentrations from 1000 µM to 10 µM (see Figure 8 and Figure S5).

